




Absorption in Order Flow: When Heavy Volume Goes Nowhere

Every lesson in this series has had the same moment in it. In the anatomy of a reversal, it was the heaviest selling of the whole move hitting the low, and price barely dropping. In the liquidity grab, it was a burst of buying above an old high that could not keep price there. In the pullback into weakness, it was buyers finally showing up in the zone, and price going nowhere. That moment has a name: absorption. This article takes it apart on its own, so you can recognise it anywhere, not only inside those patterns.
What is absorption in trading?
Every trade has two sides. One side is aggressive: a market order that takes whatever price is available right now. The other side is passive: a limit order resting in the book, waiting to be hit. A seller who hits the bid is aggressive. The buyer whose limit order was sitting on that bid is passive.
Most of the time, aggressive orders move price. Sell enough at the bid and the bids get used up, so the next trade happens a tick lower. Absorption is when that stops working. The passive side is so large that it takes everything the aggressive side throws at it, and price barely moves. Lots of volume, very little progress.
It works in both directions. Aggressive selling can be absorbed by large resting bids, usually near a low. Aggressive buying can be absorbed by large resting offers, usually near a high.
Effort vs result: the test that finds it
The clearest way to think about absorption comes from Richard Wyckoff, who traded and wrote about markets a century ago: compare the effort with the result. Effort is how much was traded, and how aggressively. Result is how far price actually moved.

The diagram shows two pushes lower after the same bar. Both sell exactly 1,500 contracts at the bid, with almost the same delta. On the left, price falls 3.5 points: the effort produced a result, and the move is healthy. On the right, the same effort moves price 1 point, and the bar closes off its low. The selling was just as strong. Someone on the other side was simply bigger.
Two practical rules make the test useful:
- Compare with the bars around it. 1,500 contracts is heavy in one market and light in another, and heavy at lunchtime is not heavy at the open. Absorption is always relative: more effort than the recent bars, less result.
- Look at the extreme of the bar. Absorption shows where a push ends: big volume at the lowest prices of a down bar, or at the highest prices of an up bar, with no follow through beyond them.
Inside the order book: why price does not move
A footprint chart shows absorption after the fact. The order book, the DOM, shows how it happens.

In the diagram, sellers hit the 6,020.00 bid five times with market orders. Each time, the bid should run out and price should tick lower. Each time, the bid is refilled to almost its old size. After five bursts, 1,530 contracts have traded at one price, and price has never traded below it.
This is how a large buyer works without showing their hand. Instead of placing one huge order that everyone can see, they show a small part of it and top it up as it gets hit. Exchanges support this directly with iceberg orders, which display only part of their size, and execution algorithms do the same thing on their own. Either way, the screen shows a few hundred contracts while the real order is many times larger.
You can watch it happen on a DOM with the recent bid and ask volume columns turned on, or on a heatmap, where the resting order shows as a line that refuses to disappear. Our comparison of Bookmap and Sierra Chart covers both views, and our DOM templates and heatmap templates set them up for you.
Where absorption matters, and where it does not
Absorption is common. Large passive orders sit in the book all day. What makes it worth your attention is where it happens.
- At the end of a move. Heavy selling at a fresh low that goes nowhere, or heavy buying at a new high that goes nowhere. This is the turning point from the reversal and liquidity grab lessons.
- At a level inside a trend. A pullback in an uptrend runs into passive buyers at a level that held before, the selling is absorbed, and the trend carries on. The pullback into weakness is the mirror of this: buyers absorbed by passive sellers where the last drop started.
- In the middle of a range, away from any level. Large orders get filled here all the time, and it rarely means much. Absorption needs context to matter.
Seen from far enough away, the accumulation phase in the article on accumulation and distribution is absorption stretched over days: a patient buyer soaking up selling inside a range.
Trapped traders: who is stuck, and why it matters
Absorption does not just stop a move. It leaves a group of traders on the wrong side of it.
Take selling that is absorbed at a low. The aggressive sellers who hit those bids are now short at the lowest prices of the move. If price lifts even a little, they are losing, and their protective buy stops sit just above the absorption area. When price reaches those stops, the stops turn into market buy orders. The traders who pushed price down end up pushing it back up.
That is why absorption at a good level can lead to a fast move away from it. Part of the fuel comes from the people who were trapped.
What happens next: absorption holds, or it breaks
Absorption is not a promise. The passive side is large, but it is not infinite, and it can change its mind.

When it holds, the aggressive side gives up. Selling dries up at the absorption price, price lifts off it, and the trapped sellers' stops add fuel. On the footprint you see lighter selling on each new test, then buyers stepping in, exactly as in the reversal lesson.
When it breaks, the passive buyer is used up, or pulls the order. Price drops through the absorption zone fast, because the orders that were holding it are gone and the stops below it fire. Now the trapped traders are the ones who bought, including anyone who bought only because they saw absorption.
The signs that it is starting to break: the bid stops refilling, each test of the level trades a little lower before it bounces, and the bounces get weaker. The read is wrong the moment price trades below the absorption price and stays there.
Common mistakes with absorption
- Calling every big print absorption. Heavy volume with a big move is just a strong move. Absorption needs the missing result.
- Ignoring location. Absorption at an obvious level after a long move matters. Absorption in the middle of nowhere usually does not.
- Acting on the absorption bar itself. The bar tells you someone is defending a price. The next bars tell you whether they win. Wait for the response, the same way you wait for the failure after a liquidity grab.
- Expecting a reversal every time. Absorption at a level inside a trend often means a pause before the trend continues, not a turn.
See it live on a footprint chart
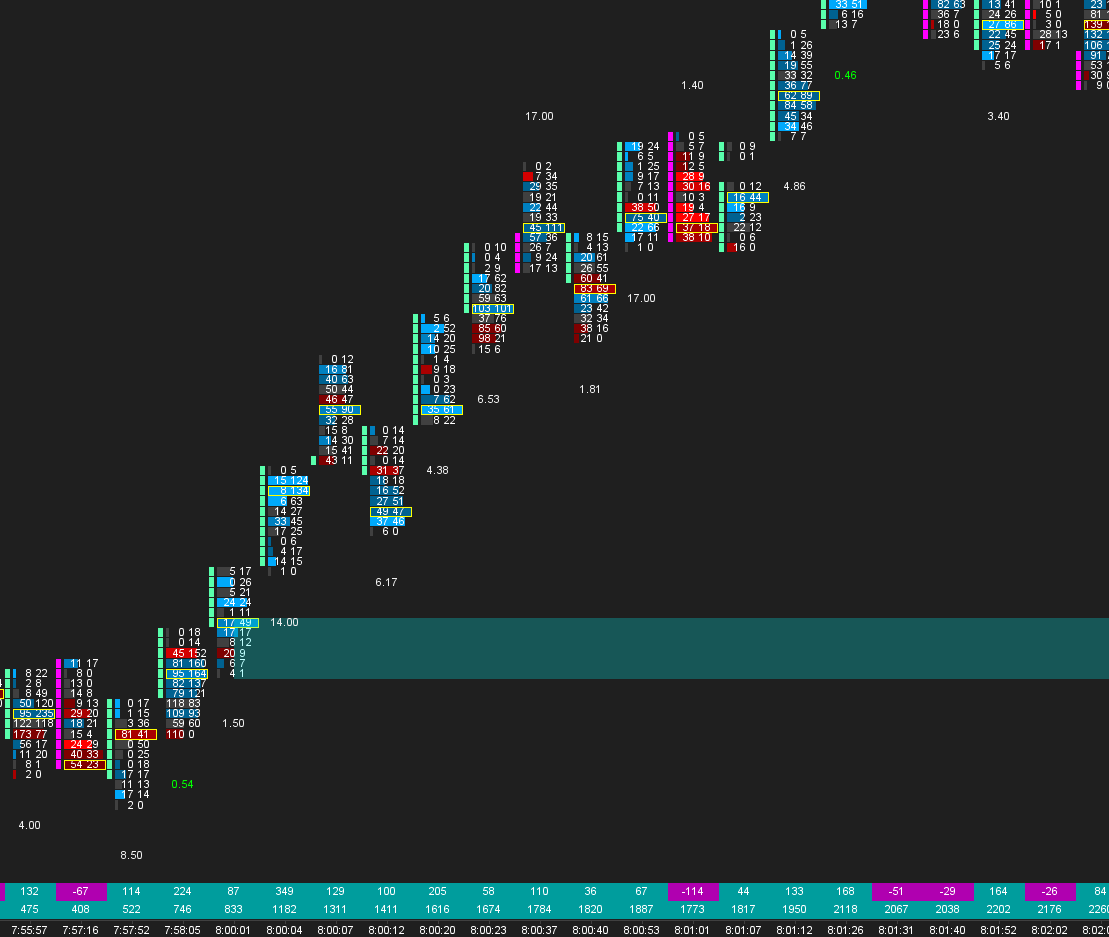
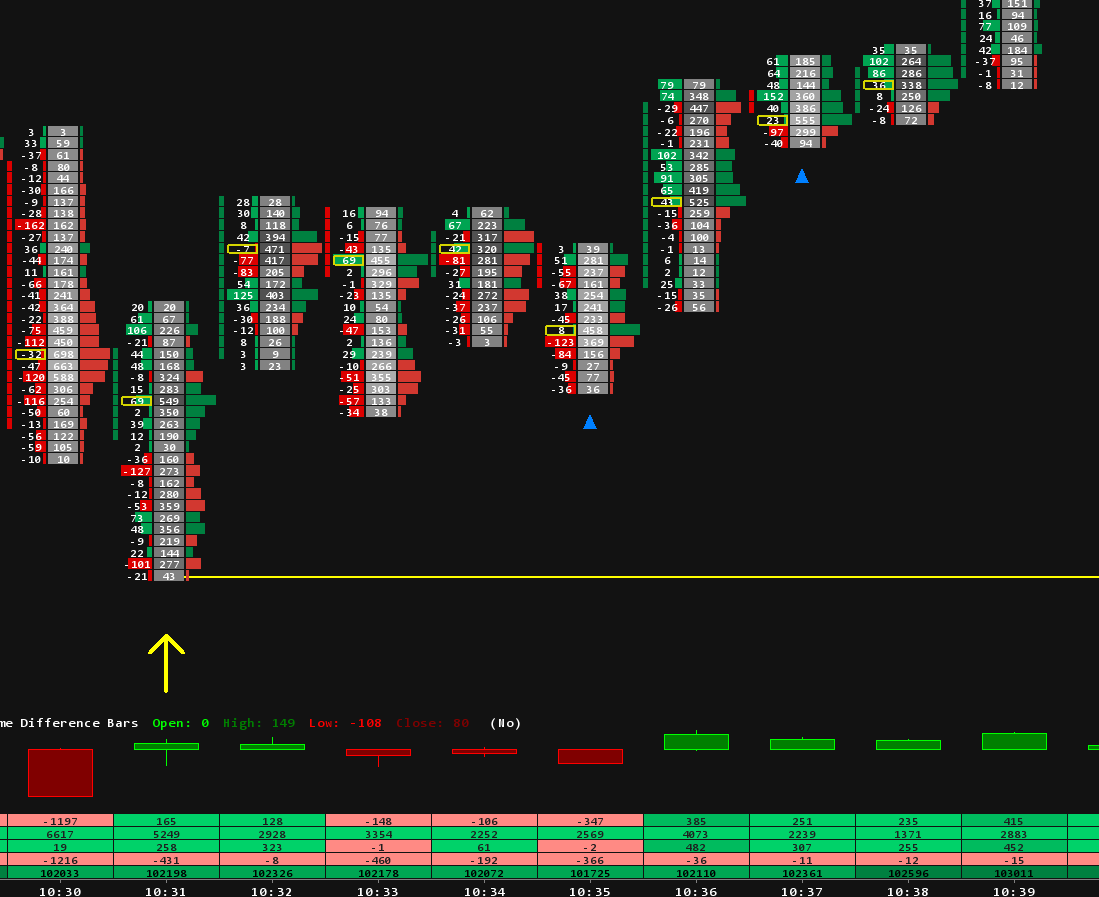
Here is a short example on ES. It is the mirror image of the examples above: aggressive buying absorbed near a high, and the buyers trapped above it.
Seeing it in Sierra Chart
Everything in this article is visible with standard Sierra Chart tools: Numbers Bars for the footprint, and the DOM with recent bid and ask volume. Our footprint setup guide walks through the first, and our footprint chart templates come with the layout already built.
Spotting absorption live, bar after bar, is the hard part, and it is what our Absorption Pack is built for. Each of its four studies maps to a part of this article:
- Absorption Bar marks the bar where a large push failed to move price in its direction: effort without result.
- Absorption Zones draws the areas where large passive orders are absorbing the market, and rates how strong each one is.
- Trapped Traders marks the absorption areas where traders are likely trapped, and tells fresh zones apart from zones price has already tested.
- Hammer with Absorption checks a hammer candle against the order flow inside it.
The rest of our studies are in the Sierra Chart indicators collection.
In the next lesson we look at delta divergence: what it means when price and delta disagree, and how that disagreement connects to absorption.
Trading futures involves substantial risk of loss and is not suitable for every investor. This article is education, not trading advice.