


Before you leave...
Check our Sierra Chart Suite PRO
 ">
">
Pre-Built Professional Sierra Chart Chartbook
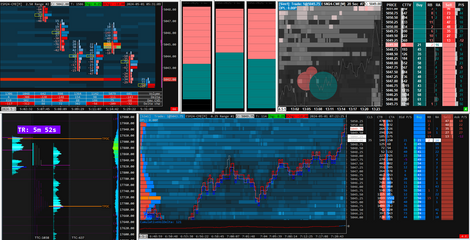
This template contains:
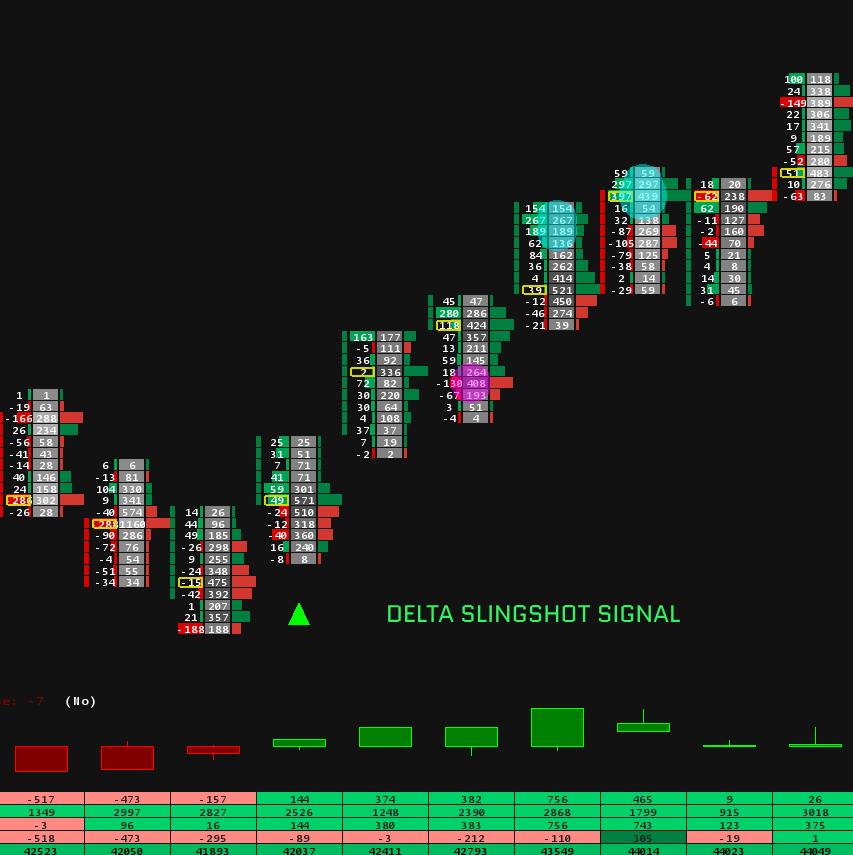
Here's a powerful tool that will help you better understand buyer and seller behavior, track volumes, and optimize your market operations.
Making trading decisions based on assumptions or incomplete analysis can lead to financial losses. Without a clear view of market movements and volumes, you risk missing lucrative opportunities or taking inappropriate positions. Moreover, it can be challenging to track volumes and filter relevant information in time and sales. You need a comprehensive tool that offers in-depth market analysis and optimized features to improve your trading on the SP500.
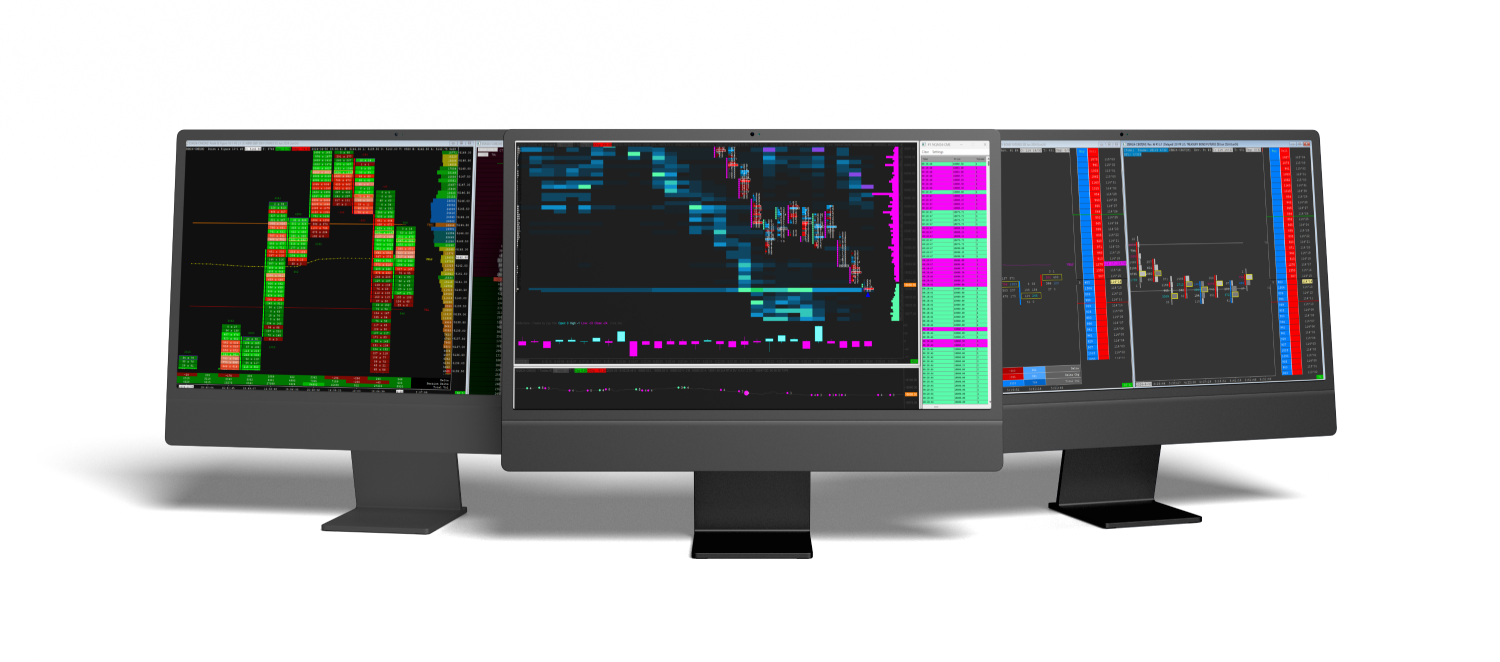
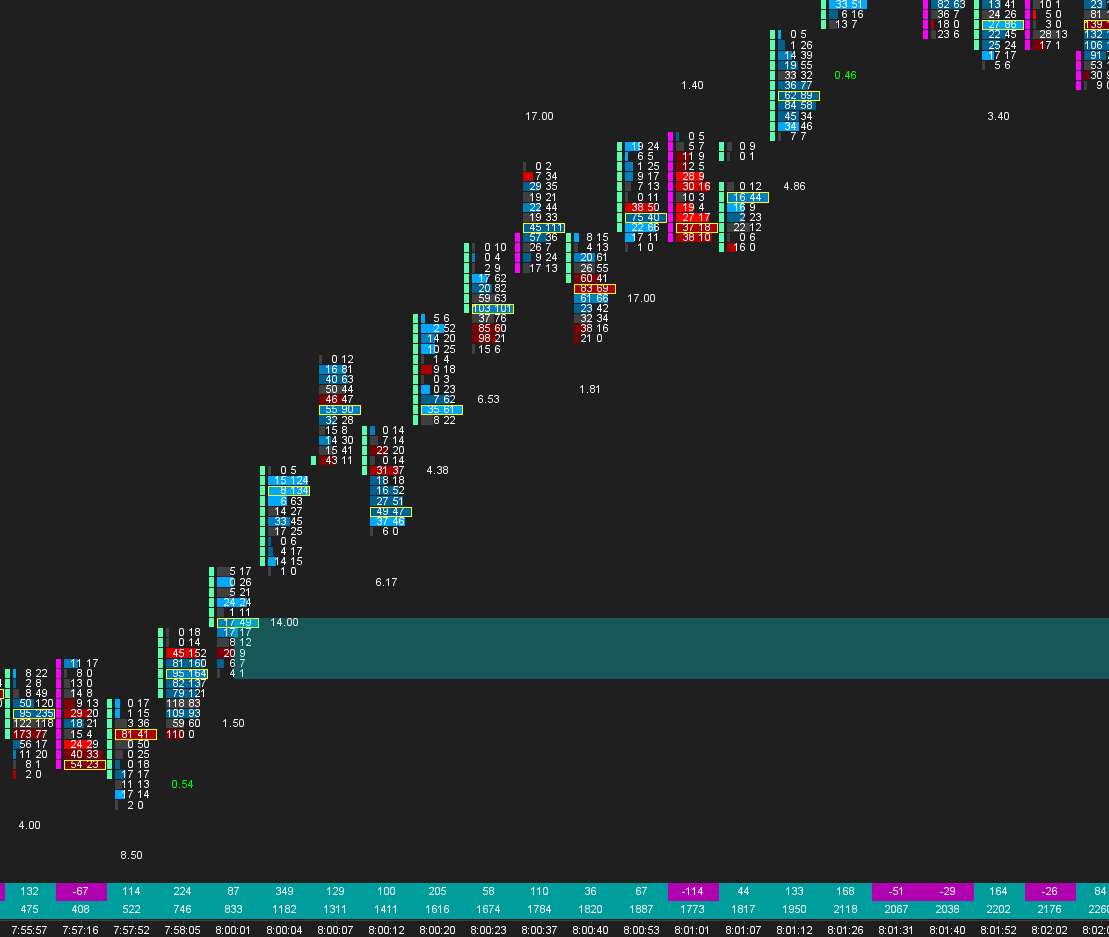
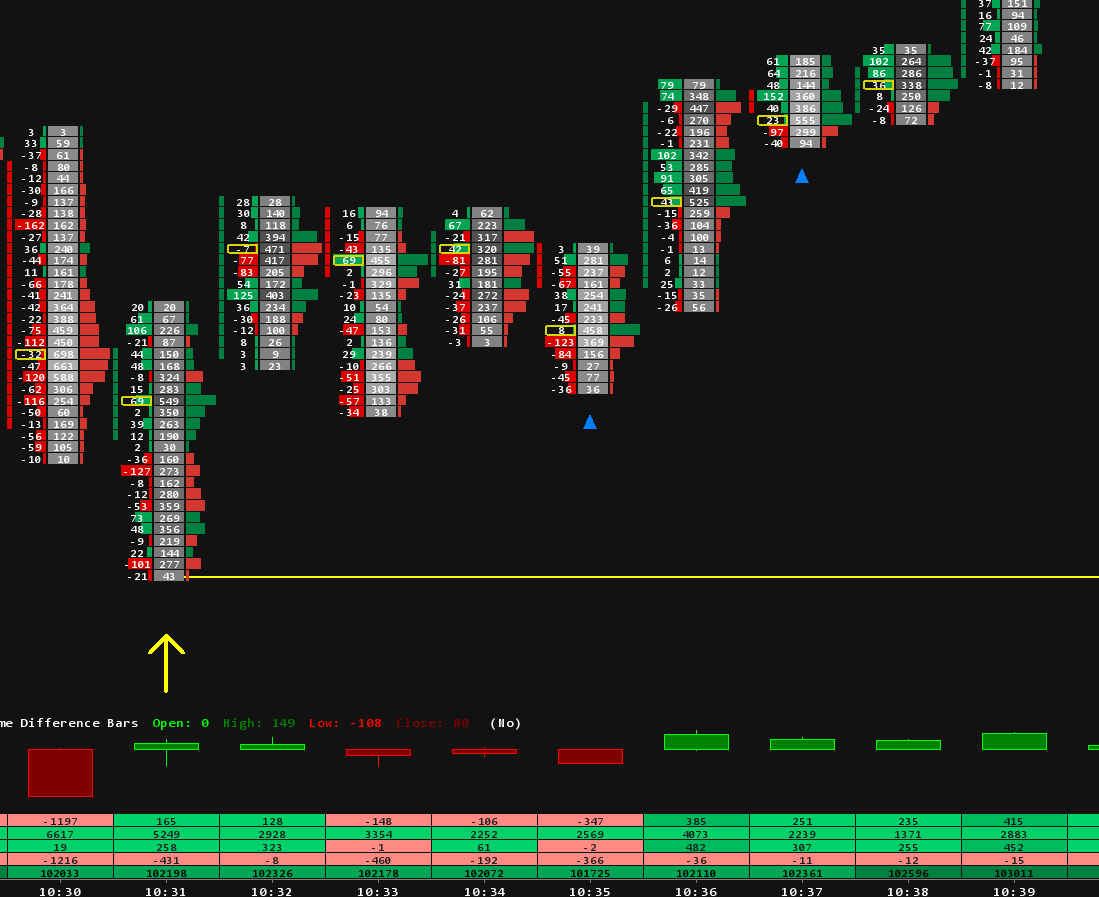
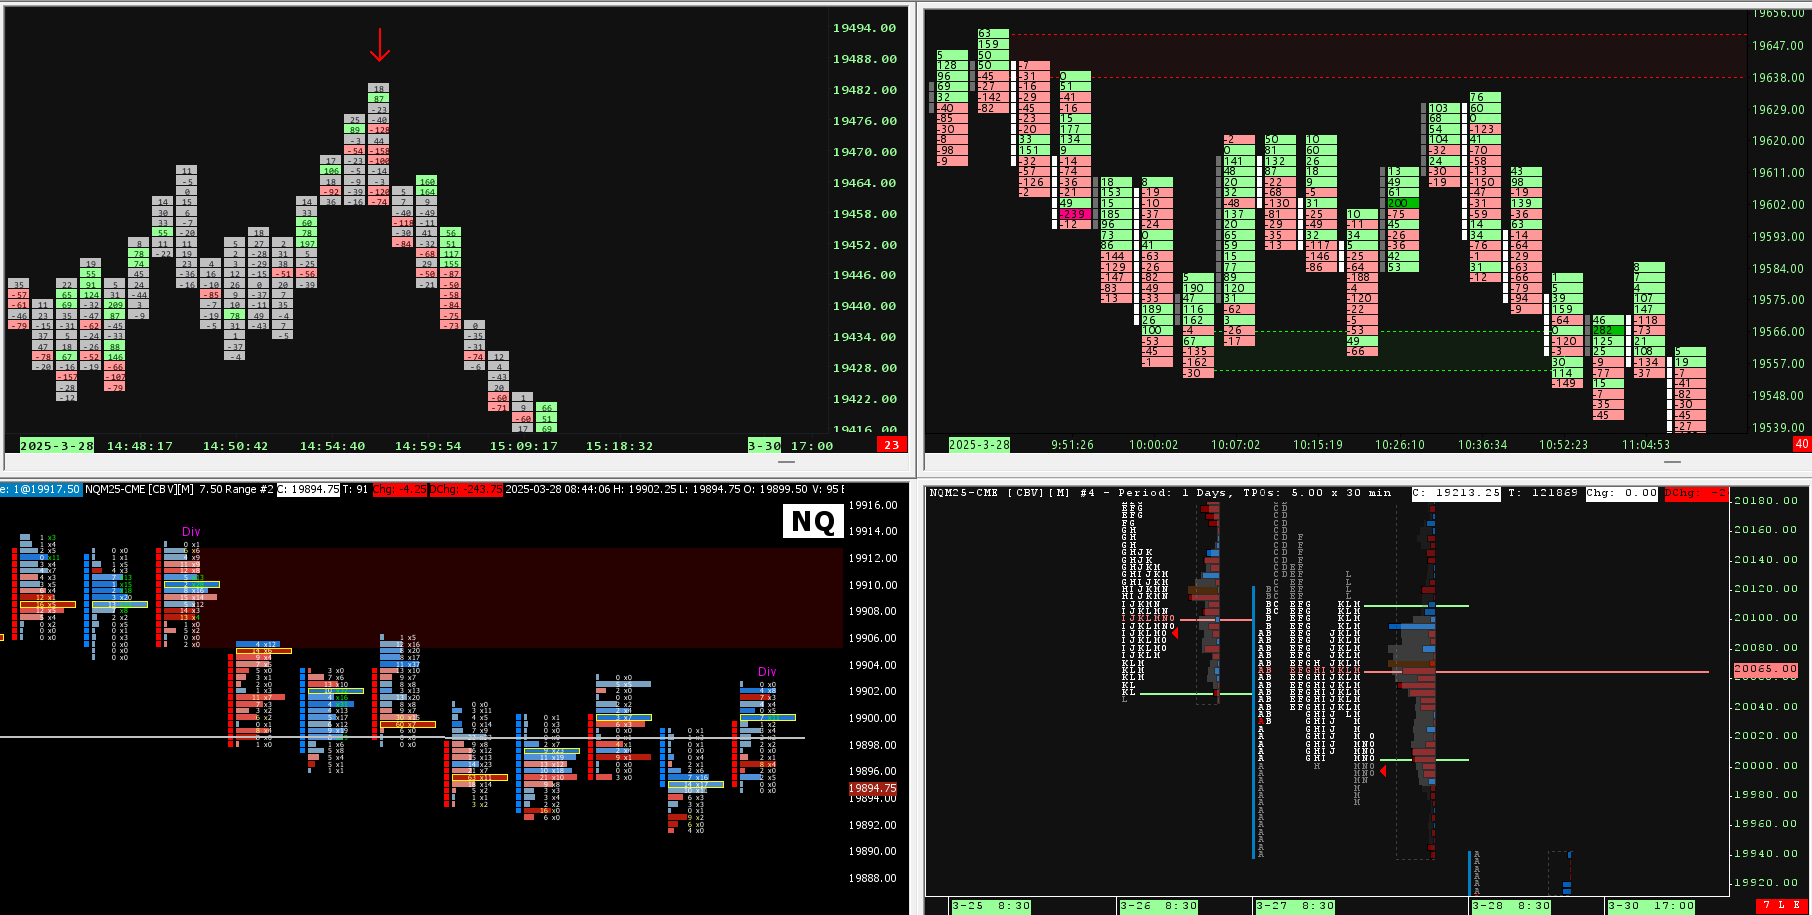
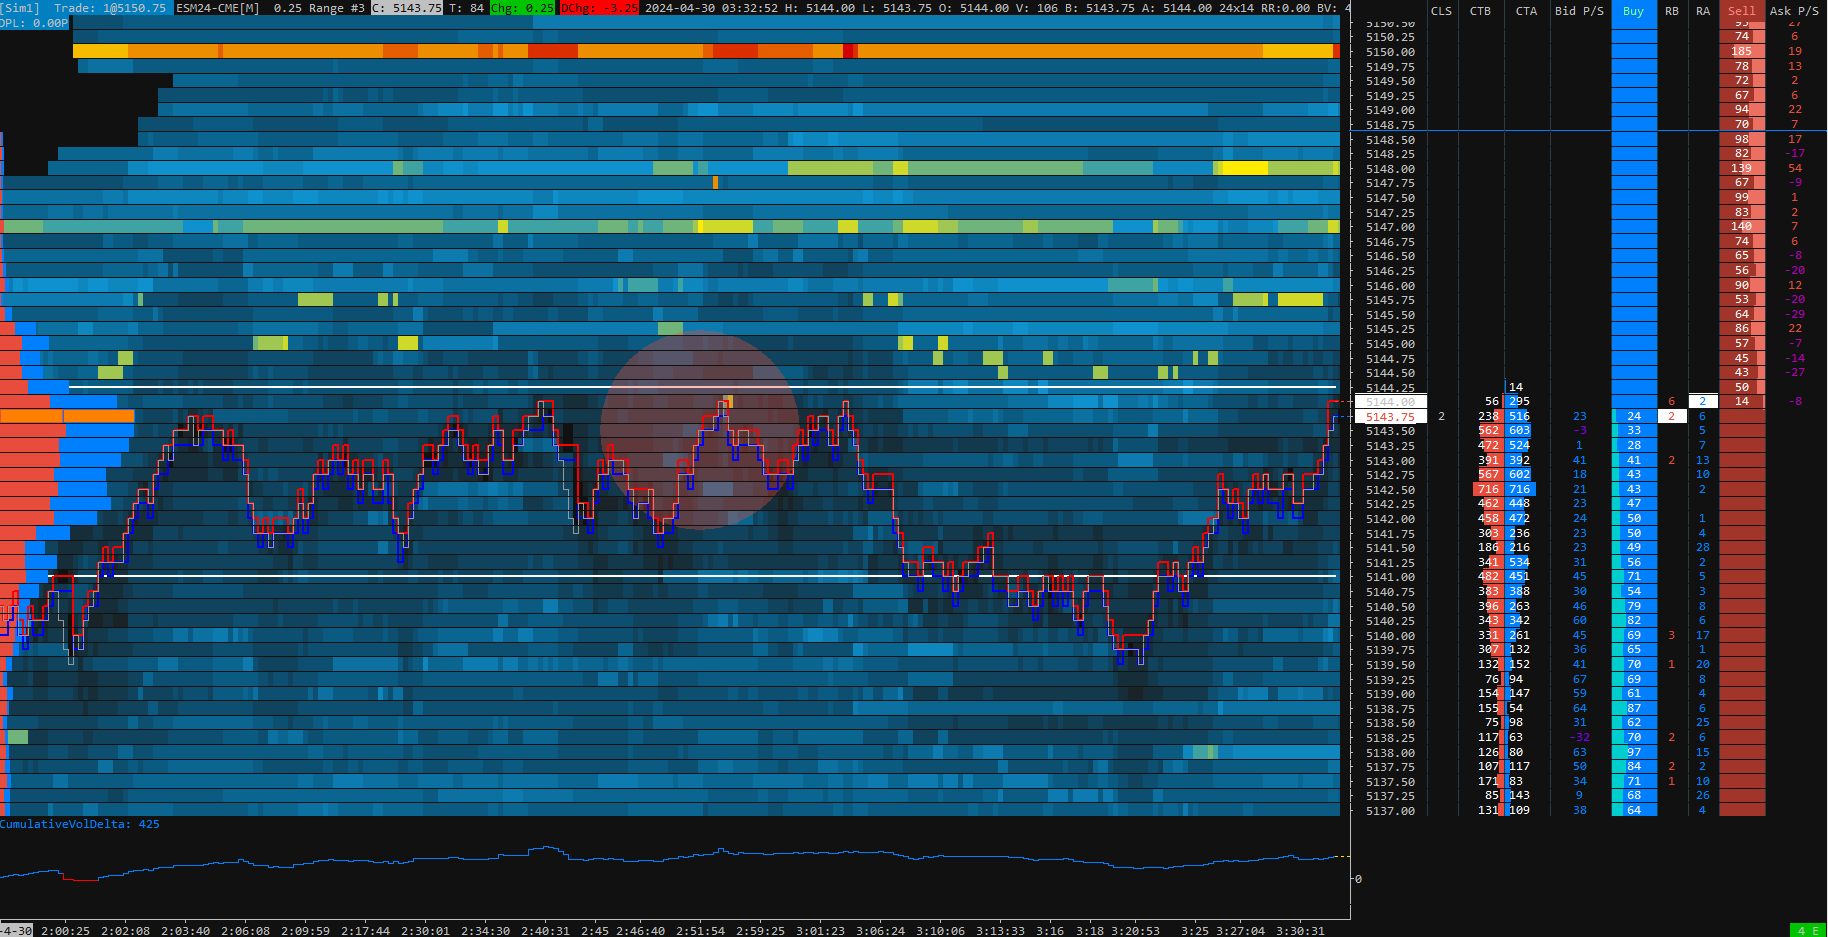
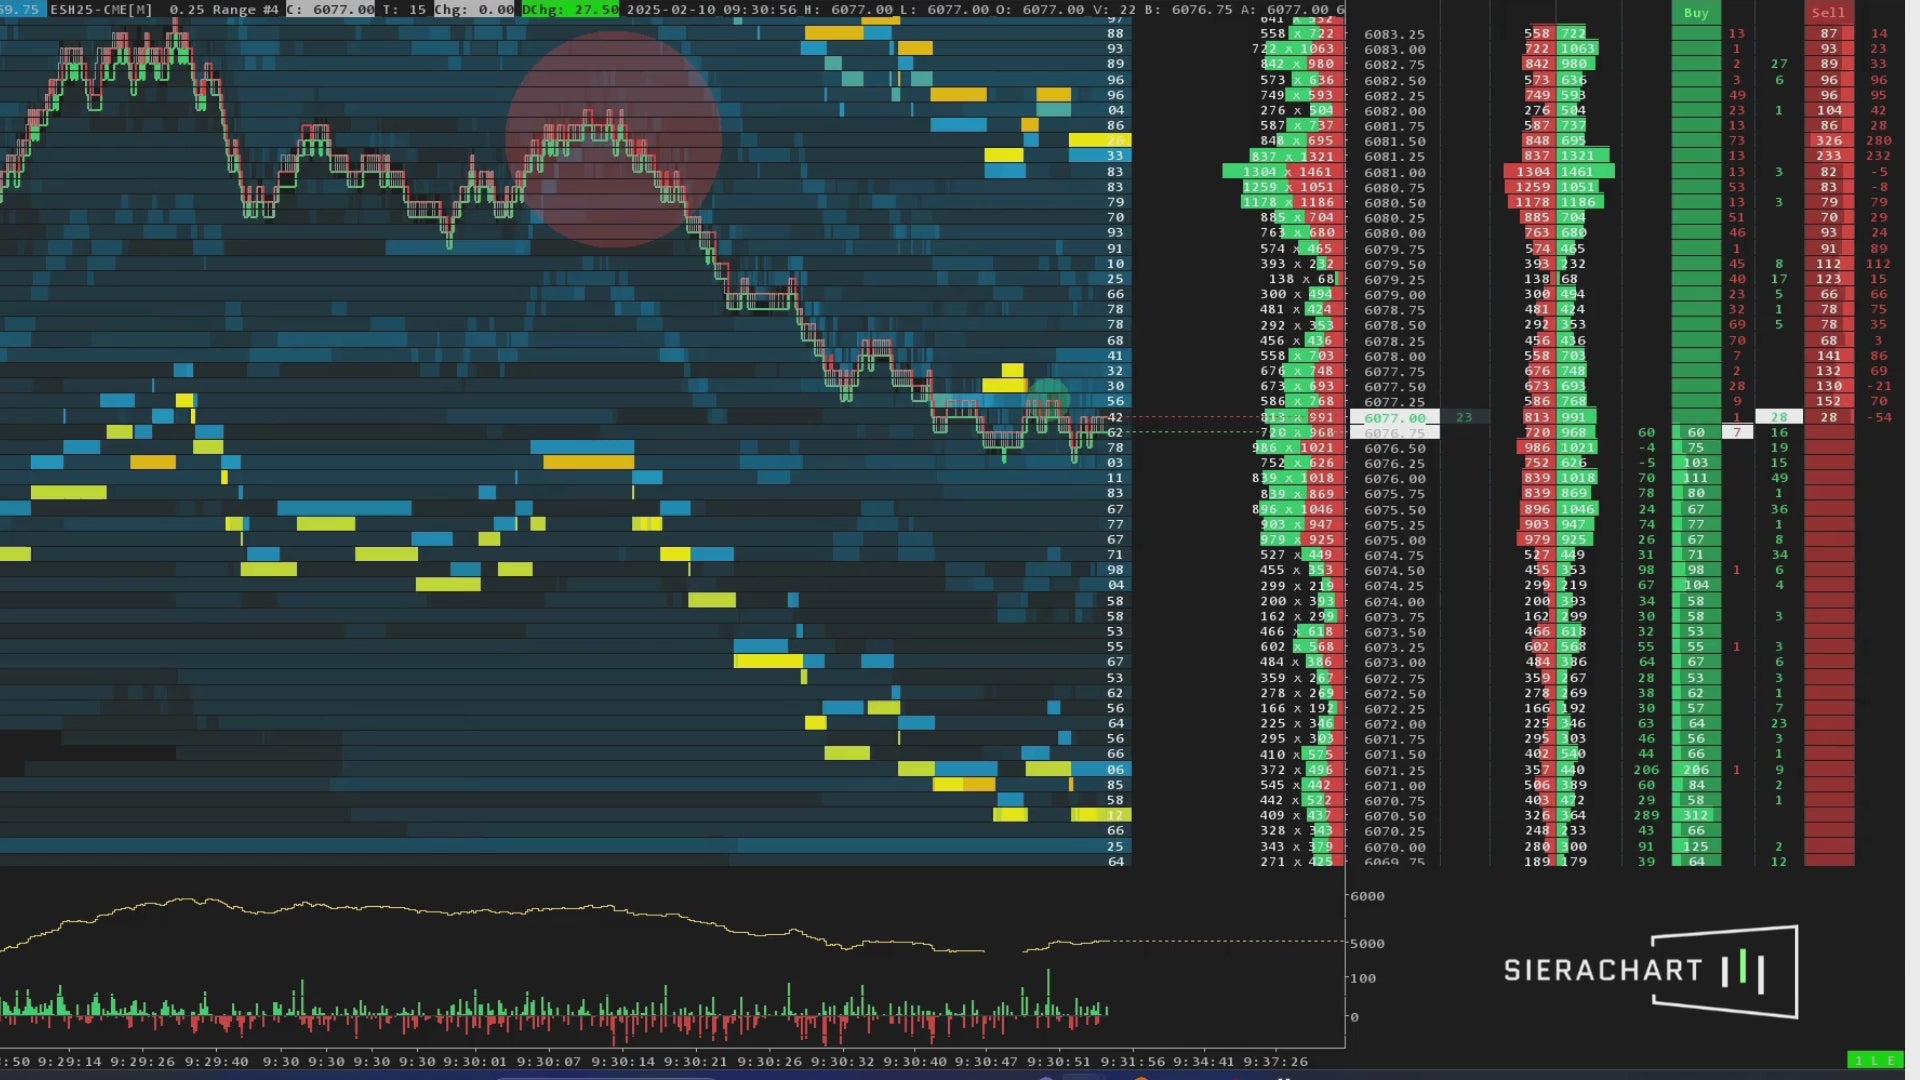
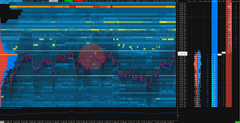
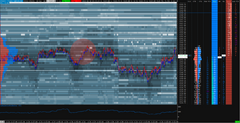
Discover our Sierra Chart "Bookmap Style Chart" template for the SP500. This revolutionary template combines several essential features to enhance your market analysis and trading decisions.
As a bonus, we've included a cumulative volume delta indicator to help you measure volume accumulation or distribution, giving you a better perspective on market trends.
Our Sierra Chart "Bookmap Style Chart" template for the SP500 is the ultimate tool for traders looking to improve their market analysis and make informed decisions. Don't miss any more important trading opportunities.
Get our template now and trade with confidence on the SP500!
MAKE SURE TO UPDATE TO THE LATEST VERSION OF SIERRACHART BEFORE USING THIS TEMPLATE! Copy the template file received by Email template.cht to your \SierraChart\Data\ folder. Restart your SierraChart platform and open the corresponding Chartbook.
To get the most out of our Sierra Chart templates, you need at least the following subscription:
“Integrated Sierra Chart with Advanced Features (Service Package 5) at 36 USD”.
We also recommend purchasing the “Denali Exchange Data Feed” data source, for access to accurate, professional market data.
(Denali : 11usd with a Stage5 broker account)
Our templates are available as one-time purchases, meaning you pay once and own the template indefinitely. There are no monthly subscription fees associated with our products, allowing you to use them without ongoing costs.
- Be sure to update to the latest version of sierrachart.
- Copy the template file received by Email, template.cht into your \SierraChart\Data\ folder.
- Restart your Sierra Chart platform and open the corresponding Chartbook.
Unfortunately, we do not offer trial versions of our Templates / Chartbooks. However, we provide detailed descriptions and support to help you understand how our templates work and how they can enhance your trading experience.
Yes, we offer 7 days Trial for our indicators, please email us your sierra chart username for activation.
We are committed to providing high-quality templates. Refunds are only issued for verified technical issues with our products. Technical support is available to assist you in resolving any problems you may encounter.
Our team of traders and Sierra Chart experts also offers personalized coaching to help you get started with the Sierra Chart platform.
Our templates are optimized and configured to work on a specific market (NQ, ES, ZN, Gold...). However, if you have advanced knowledge of your market and SierraChart, it is possible to modify the settings to match the characteristics, schedules, etc. of another market.
Thanks for subscribing!
This email has been registered!
| Product | SKU | Description | Collection | Availability | Product Type | Other Details |
|---|