




Bookmap vs Sierra Chart: Which One for Order Flow Trading?

Bookmap draws the order book as a living heatmap, and that single visual is the reason most traders know its name. Sierra Chart is a complete futures trading platform that can draw a very similar heatmap, along with footprint charts, Market Profile, volume profiles and a trading DOM. The two tools overlap in exactly one place, liquidity visualization, and differ almost everywhere else. This comparison covers what each platform actually does, what each costs in 2026, and how traders get a Bookmap style view inside Sierra Chart.
Two different tools that overlap in one place
Bookmap is a visualization product first. Its core screen shows historical and real time order book depth as a color heatmap, with traded volume drawn as bubbles on top. Setup is minimal and the first chart you open already looks like the screenshots on their website. Charting in the classic sense, indicators, drawing tools, custom timeframes, bar types, is intentionally thin.
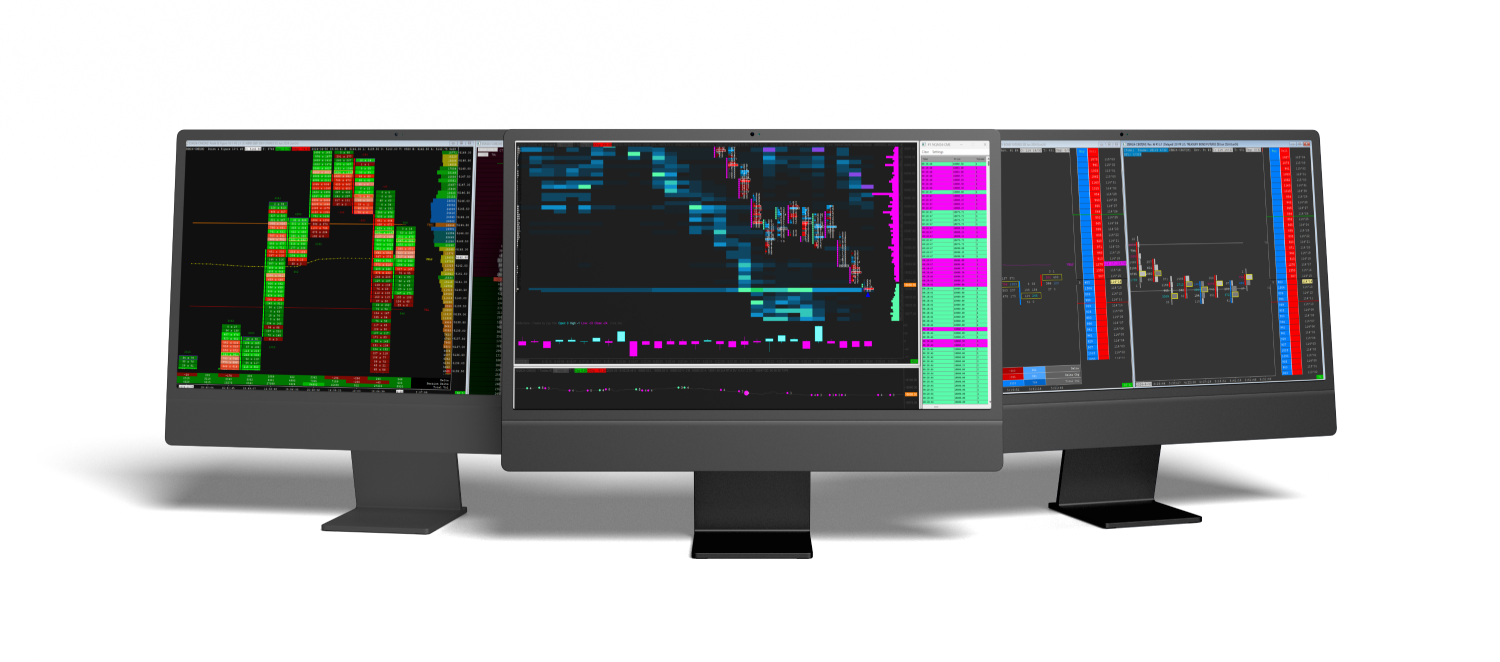
Sierra Chart is the opposite starting point. It is a full trading platform used for charting, order routing, automation and market analysis, known for its low resource usage and its depth of configuration. Nothing looks polished out of the box, and nearly everything can be built: footprint charts through Numbers Bars, TPO Market Profile, volume profile studies, a customizable DOM, spreadsheet systems and C++ custom studies through ACSIL. Its answer to Bookmap is a study called the Market Depth Historical Graph, which renders the same style of liquidity heatmap from recorded depth data.
The heatmap, side by side

On pure heatmap rendering, Bookmap remains the reference. Zooming is smooth, the color scale is tuned by default, and iceberg detection add ons are available in higher tiers. It is a strong tool for watching how resting liquidity behaves around a level.
Sierra Chart's Market Depth Historical Graph produces a comparable picture once configured, and it improves further with market by order data on the highest data package. The difference is that in Sierra Chart the heatmap is one study among many on the chart. The same window can carry a footprint, a volume profile anchored to the session, VWAP bands and your working orders. Traders who want the heatmap as context inside a full analysis workspace usually end up here. Traders who want the heatmap as the whole screen usually stay with Bookmap.
Does Bookmap have footprint charts?
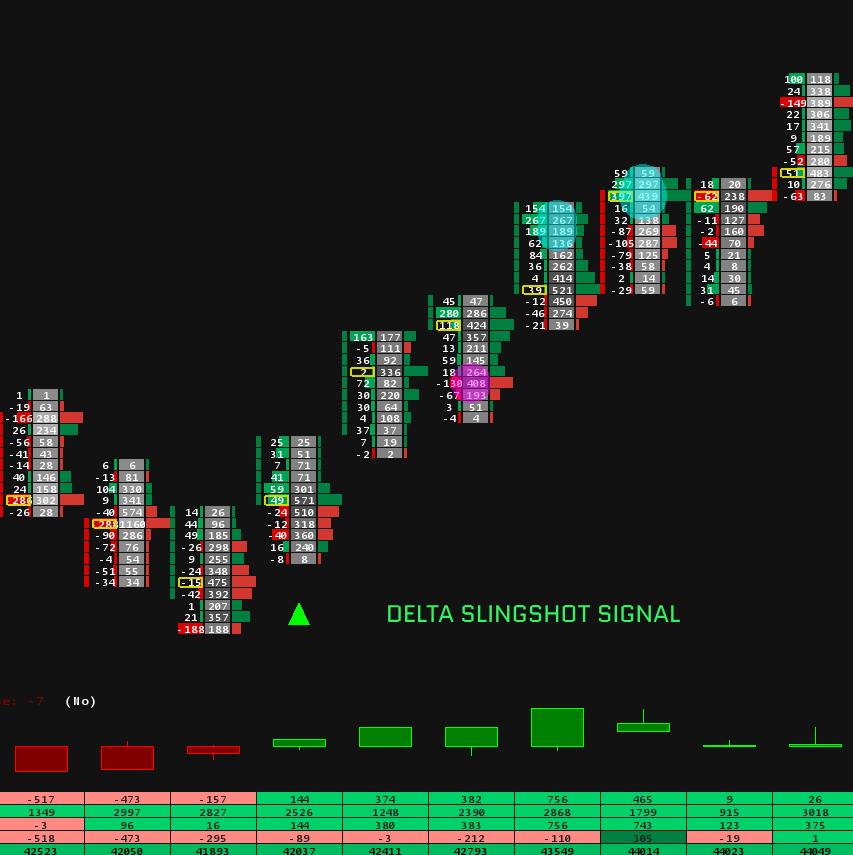
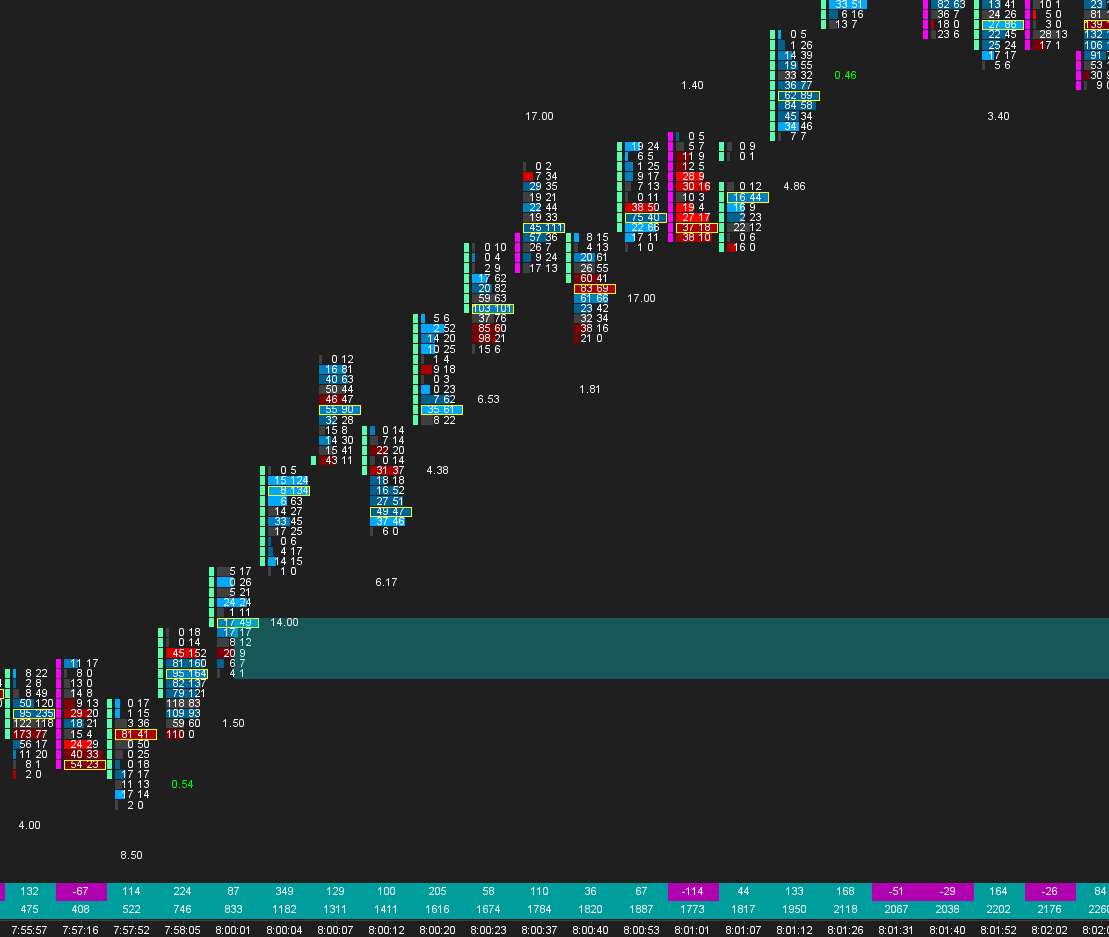
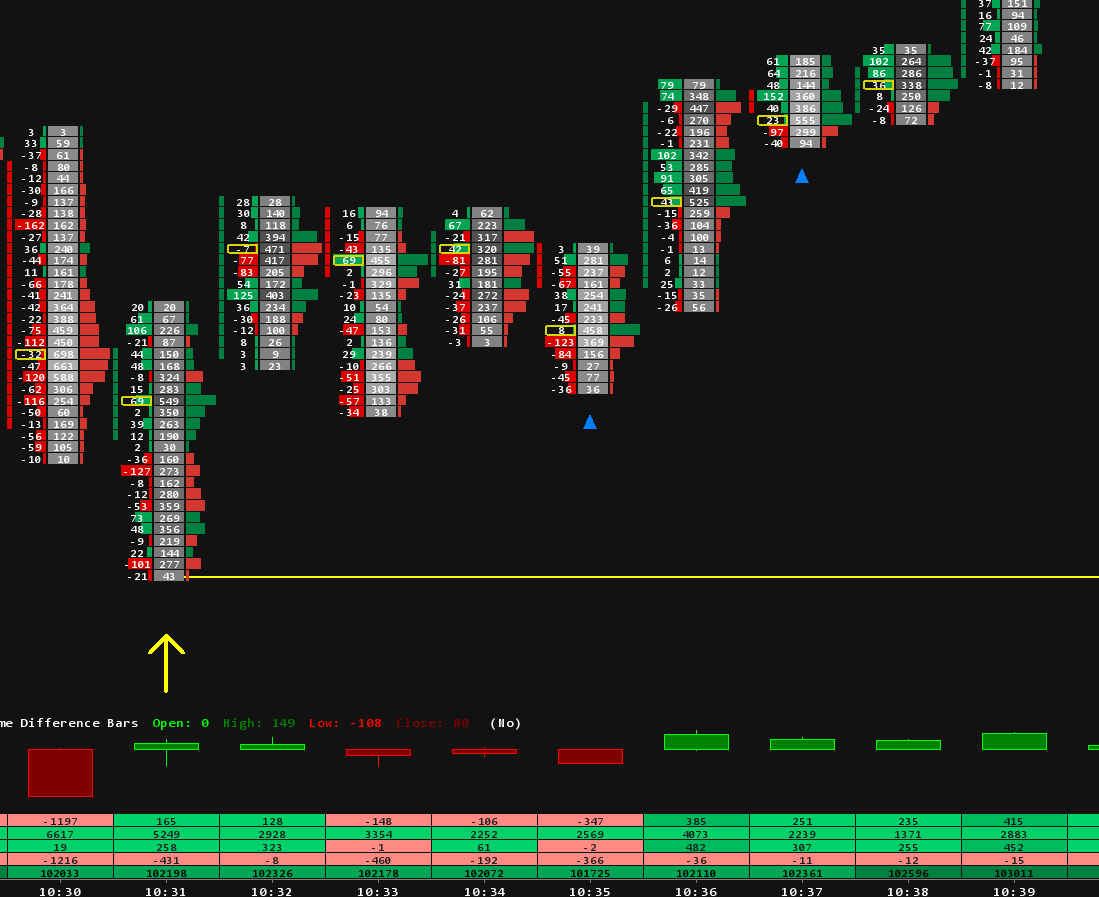
Not in the traditional sense. Bookmap shows executed volume as bubbles and offers imbalance style markers, but it does not draw the classic bar by bar footprint grid with bid and ask volume in each cell. Sierra Chart's Numbers Bars is a complete footprint implementation: bid ask splits, delta, imbalances, diagonal ratios, unfinished auctions and cell coloring are all configurable. If footprint reading is central to your process, this difference usually settles the question by itself. Our footprint chart templates exist because of how deep that configuration goes.
What each one costs in 2026
Prices below are the published monthly rates in August 2026. Both vendors change pricing from time to time, so the official pages linked here are the reference.
| Platform | Plan | Monthly price | Notes |
|---|---|---|---|
| Bookmap | Digital Plus | $19 | Crypto focus, no futures data |
| Bookmap | Global | $49 | Futures capable, market data billed separately |
| Bookmap | Global Plus | $99 | Adds advanced modules and detection tools |
| Sierra Chart | Package 3, Base Standard | $26 | Charting only, no external data services |
| Sierra Chart | Package 5, Base Advanced | $36 | Adds advanced features, no Denali feed |
| Sierra Chart | Package 11, Integrated Advanced | $46 | Supports the Denali Exchange Data Feed |
| Sierra Chart | Package 12, Integrated Advanced MBO | $56 | Adds market by order depth, the best heatmap detail |
Exchange data comes on top for both platforms. For Sierra Chart, CME depth through the Denali feed starts around $11 per month with a participating broker account. Bookmap bills CME data separately as well, typically from around $34 per month. Current details are on the Sierra Chart packages page and the Bookmap packages page.
Where each platform wins
Bookmap is the better choice when the priority is watching liquidity right now with zero configuration. The rendering is best in class, the learning curve is short, and the add on marketplace covers detection tools without any programming.
Sierra Chart wins on breadth and on cost at the professional end. One platform carries the heatmap, footprints, Market Profile, volume profiles, DOM trading and automation, and the fully loaded configuration with MBO data still costs less than Bookmap's top tier before data. The tradeoff is honest: Sierra Chart asks for configuration time, and its interface shows its age. That configuration burden is exactly what preconfigured chartbooks remove.
How to get a Bookmap style heatmap inside Sierra Chart

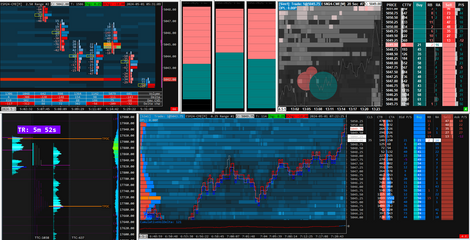
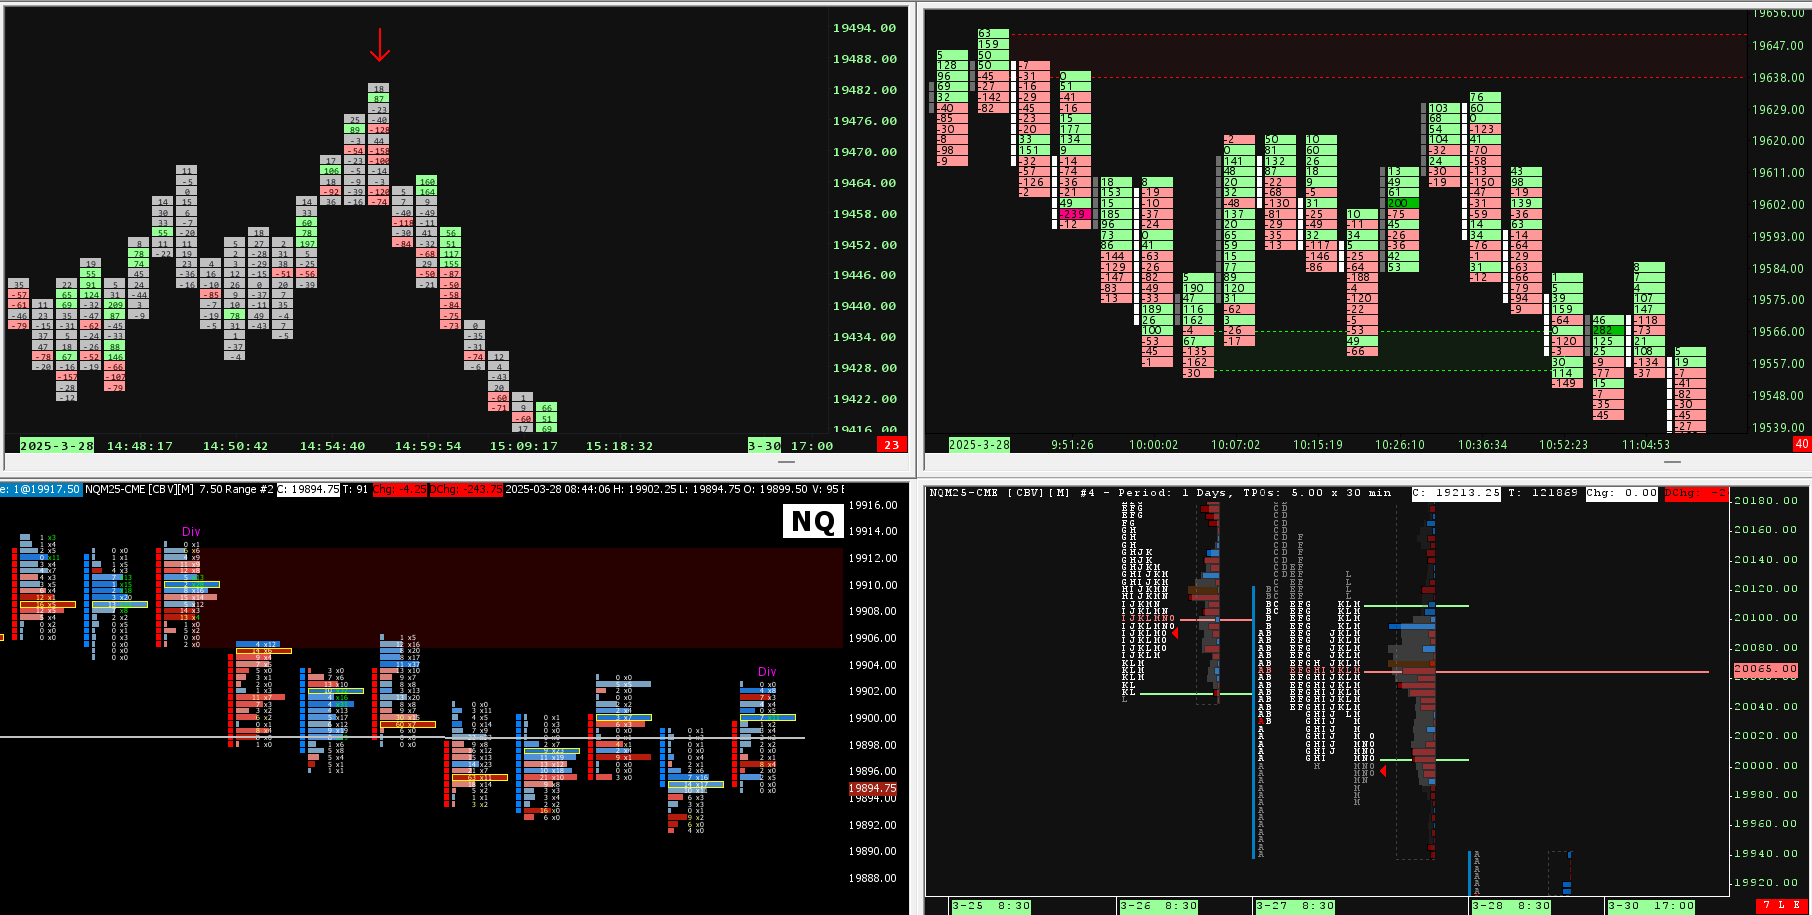
The Market Depth Historical Graph study needs depth data, sensible color scaling, and a chart layout that keeps the heatmap readable next to price. Building that from scratch is a weekend of trial and error, which is why our Bookmap style chart template for ES ships as a ready chartbook: heatmap, DOM, tape and volume profile arranged in one workspace, tuned for S&P 500 futures. The wider heatmap template collection covers NQ and other instruments, and pairs naturally with the DOM templates for order book trading. The full catalog lives under Sierra Chart templates. For the reading side of order flow, the guide to order flow sequencing is the natural next article.
Quick answers
Is Sierra Chart cheaper than Bookmap?
For a futures ready setup, yes in most configurations. Sierra Chart Package 11 at $46 plus Denali data undercuts Bookmap Global Plus at $99 plus data, and it includes far more than the heatmap.
Do I need MBO data for the heatmap?
No. Standard depth data already draws a useful heatmap in Sierra Chart. Package 12 adds market by order granularity, which sharpens the picture and enables order level analysis, and it is the closest match to what Bookmap renders.
Can I run both platforms?
Many traders do exactly that during a trial month, then keep the one they actually watch. The combined subscription cost usually makes the trial period the moment to decide.
Does the Bookmap style template work on instruments other than ES?
The ES template is tuned for S&P 500 futures ticks and volume. Other instruments need different scaling, which is what the instrument specific templates in the heatmap collection are for.