




Anatomy of a Reversal: Reading the Turn on a Footprint Chart

In the last article we followed a large position from accumulation to distribution, and saw how a downtrend ends: the selling loses force, stops working, tries one more time and fails. This article zooms in on that turn. First the six stages you can see on any chart, then the same turn on a footprint chart, bar by bar, so you know which numbers matter when a market tries to reverse.
What is a reversal, and how is it different from a pullback?
A downtrend is a sequence of lower highs and lower lows. A pullback is a pause inside that sequence: price bounces, makes another lower high, and the trend carries on. A reversal changes the sequence itself. The market stops making lower lows, makes a higher low, and then breaks the last lower high.
That definition tells you what to wait for. A low price is not a reversal. A big green candle is not a reversal. Until structure changes, every bounce in a downtrend is a pullback by default, and most of them fail. The work is to notice the change in behaviour early, then let structure confirm it.
The six stages of a reversal
Not every reversal shows all six, and they do not always arrive in this neat order. But when several of them line up at the same place, the turn is worth taking seriously.

- An established downtrend. Lower highs and lower lows. There has to be a trend to reverse, and plenty of traders positioned with it.
- A sweep of the previous low. Price trades through an obvious low. Stops from longs sitting under it get triggered, and breakout sellers jump in. That burst of selling is exactly the liquidity a large buyer needs.
- Absorption. The selling is heavy, but price barely moves. Someone with resting bids is taking all of it.
- The reclaim. Price comes back above the old low. The breakdown has failed, and everyone who sold the break is now short below the market.
- A shift in structure. The first higher low, then a higher high. The run of lower lows is broken.
- Confirmation. Price breaks the last lower high, the top of the last bounce before the low. Until then, the move is still a bounce in a downtrend.
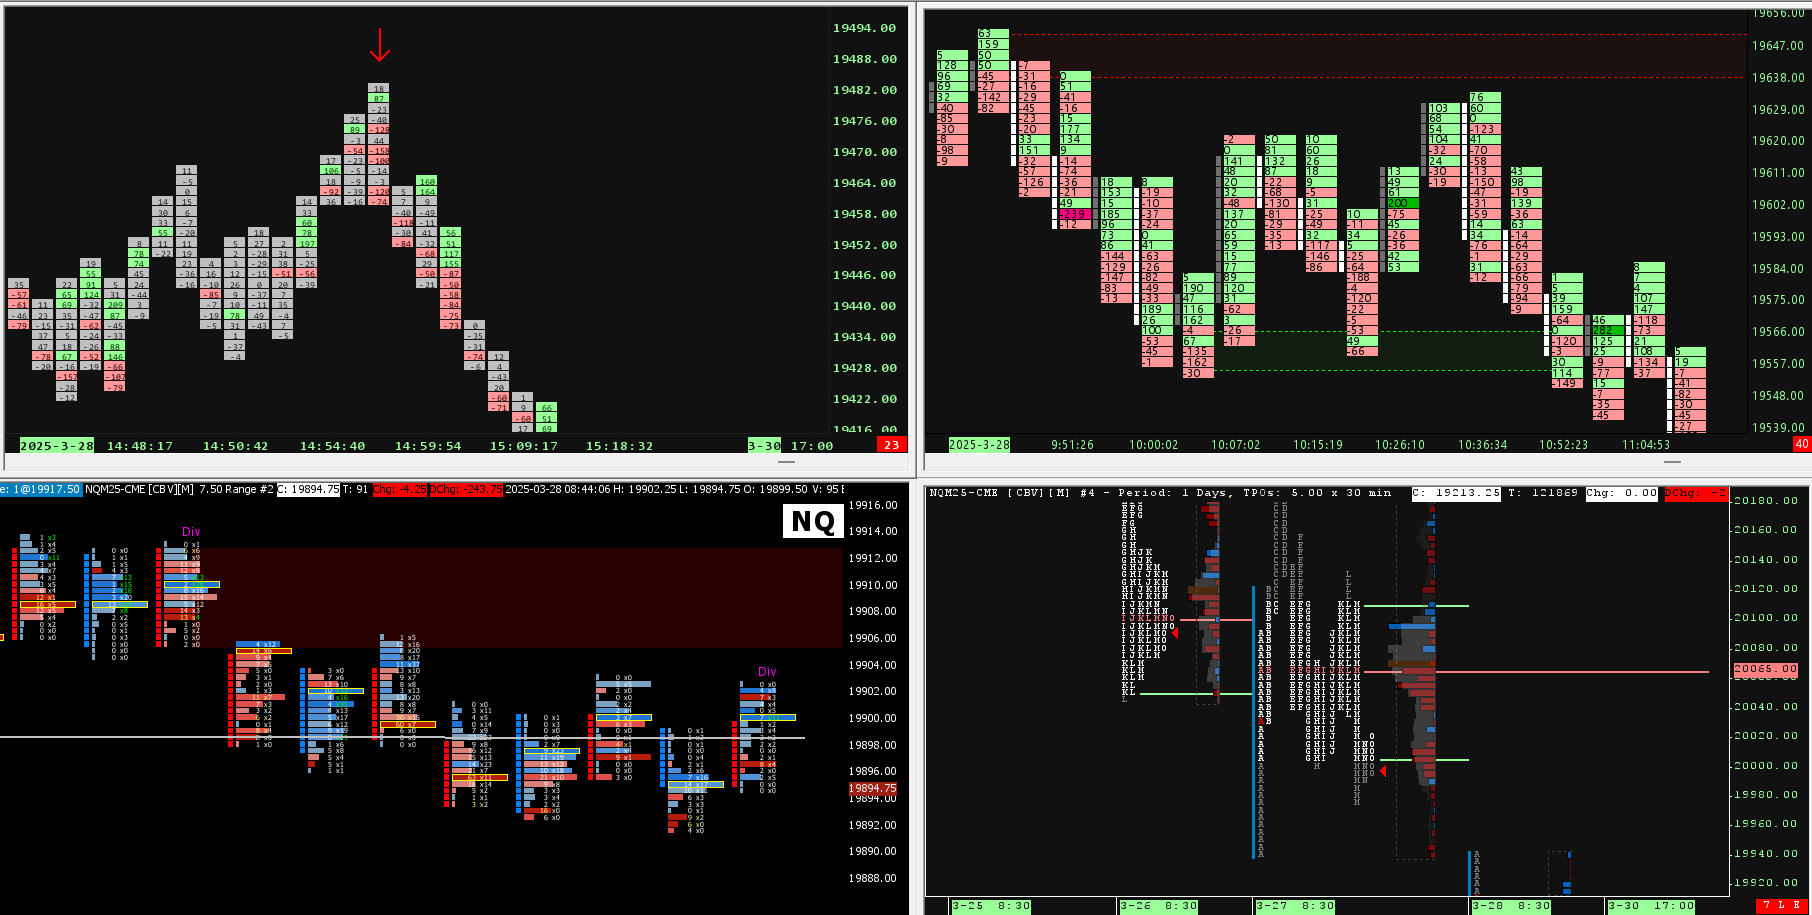
Stages 2 to 5 often happen within a handful of bars. On a candle chart they look like a long lower wick and a quick recovery. On a footprint chart you can see who traded, at which price, and what it achieved.
How to read a footprint chart in two minutes
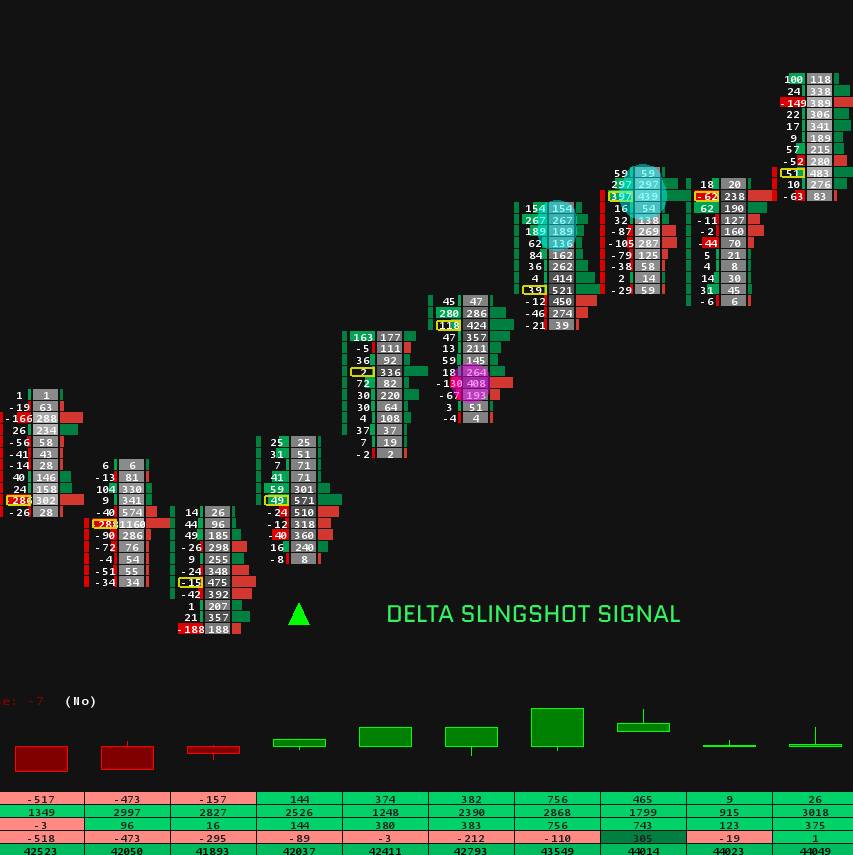
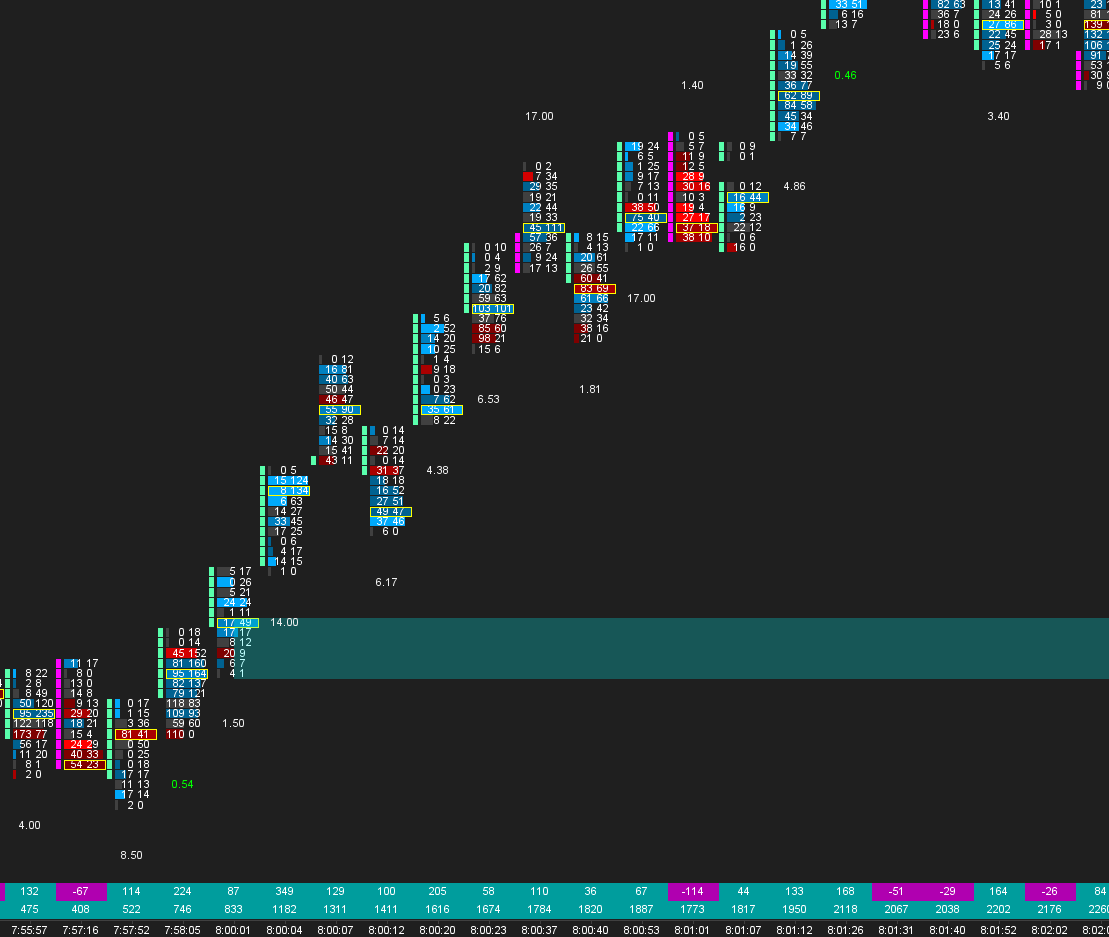
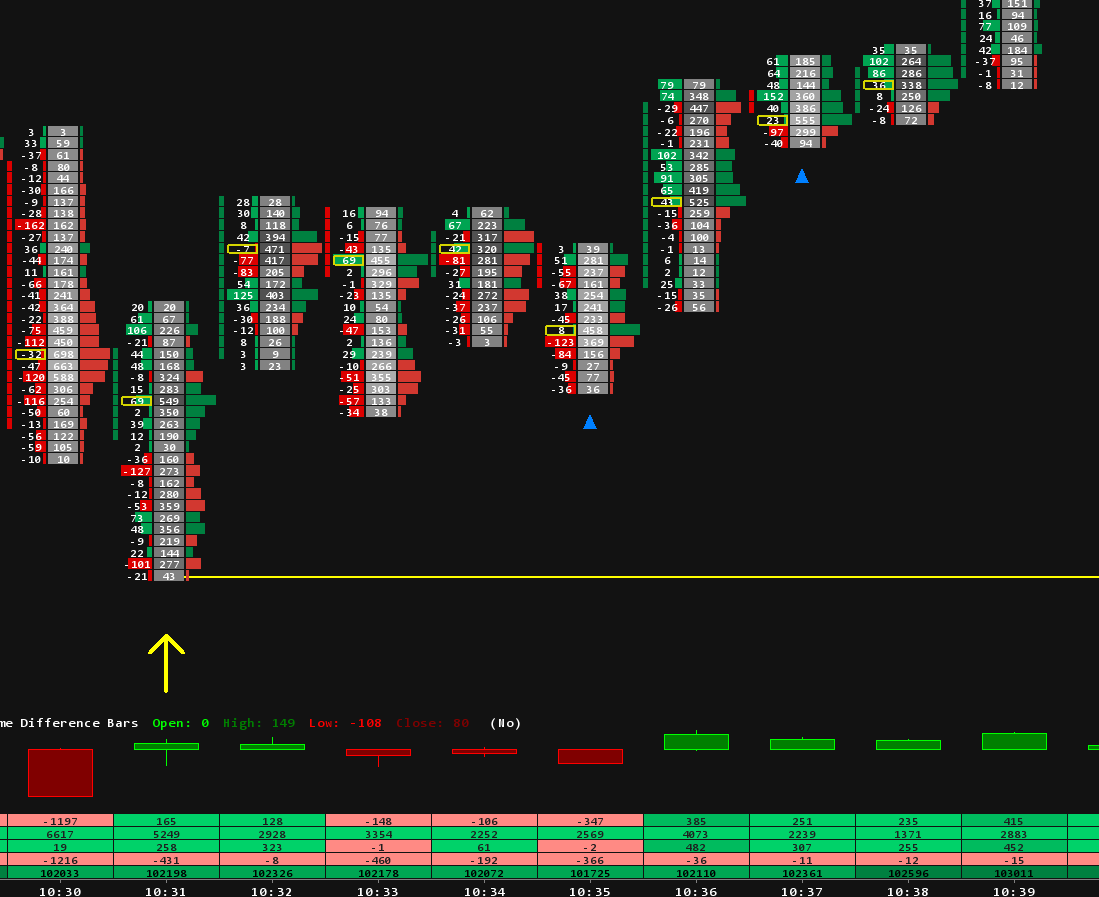
A footprint chart, which Sierra Chart calls Numbers Bars, splits each bar into its prices and shows the volume traded at each one. In the diagram below, each cell shows the contracts sold at the bid on the left and the contracts bought at the ask on the right. Someone who sells at the bid is an aggressive seller; someone who buys at the ask is an aggressive buyer. Three more readings:
- Delta is the buying at the ask minus the selling at the bid for the whole bar. Negative delta means aggressive sellers traded more than aggressive buyers.
- An imbalance is a cell where one side traded at least three times the other, compared on the diagonal: the ask at one price against the bid one level below. The diagram shows them in bold.
- The outlined cell is the price where the bar traded the most volume.
If you have never built one, our footprint setup guide walks through Numbers Bars step by step, including the imbalance setting.
The turn, bar by bar
The numbers below are an illustration, not real market data, but the pattern is one you will recognise once you have watched a few turns live.

Bar 1: the push lower
Sellers are in control. The bar closes on its low, delta is minus 737, and there are three stacked sell imbalances in the middle of the bar: aggressive sellers hitting bids at several prices in a row. Nothing here says reversal. This is what a healthy downtrend looks like.
Bar 2: the sweep
Price breaks the previous low at 6,011.00. This is the heaviest bar of the sequence: 2,140 contracts, delta minus 1,060, and three more stacked sell imbalances right at the bottom. At the two lowest prices alone, 1,130 contracts were sold at the bid.
Read it twice, because this is the bar most traders get wrong. On the numbers alone it looks bearish: the strongest selling of the move. Now look at the result. All that selling moved price one point below the old low, and the bar closed above its low. When aggressive selling of that size gains so little ground, someone is absorbing it with passive bids. And the sellers who did it are now short at the lowest prices of the move.
Bar 3: the retest
Price goes back down but does not make a new low. At the low of this bar only 38 contracts were sold at the bid, against 610 at the low of the bar before. The sellers who were so eager a moment ago are gone. The bar closes at 6,011.50, back above the previous low, with positive delta. That is the reclaim: the breakdown has failed.
Bar 4: buyers step in
Now the other side responds. Delta jumps to plus 620 and there are three stacked buy imbalances: aggressive buyers lifting offers at three prices in a row. Note the order of events. The buying arrives after the selling has failed, not before. That is the difference between trying to catch a falling market and joining a turn that has started.
Bar 5: the higher low
The first pullback after the reclaim. It holds at 6,012.00, above the old low and well above the sweep low, on just 319 contracts, the lightest bar of the sequence, with delta close to zero. Sellers had a chance to push price back down and did not take it. A pullback on light volume that holds above the old low is the first higher low.
Bar 6: the higher high
Price takes out the high of bar 4 with positive delta and more buy imbalances. On this small scale, structure has shifted: a higher low, then a higher high. On the bigger chart the move still has one job left, which is breaking the last lower high. Until it does, this is a bounce that is going well, not a confirmed reversal.
Why does the sweep happen at the old low?
Because that is where the orders are. A previous low is the most obvious level on the chart. Traders who are long put their stops just under it, and breakout traders place sell orders there to catch the next leg down. When price gets there, all of those orders turn into market sell orders at once.
For a large buyer that is the best moment to fill. As we saw in the article on accumulation and distribution, a big position can only be built against someone else's selling, and the sweep delivers a burst of it at one price. That is why the heaviest selling of a move so often prints right at the low.
What delta can and cannot tell you
Delta tells you which side was more aggressive. It does not tell you who won. In bar 2 the sellers were far more aggressive and still lost the bar, because the passive buyers on the bid were bigger. So read delta against price:
- Strong negative delta and price moves down: the sellers are getting what they pay for.
- Strong negative delta and price barely moves: the selling is being absorbed.
- Positive delta right after a failed low: the other side is now pressing.
On its own, a delta number says very little. The same reading can mean continuation in one place and absorption in another.
Where this read goes wrong
A pattern that only works in hindsight is not much use, so here is how this one fails.
- The absorption gives way. Passive buyers can be overwhelmed. If price keeps printing new lows after the sweep, there was no absorption, just a slower decline.
- No reclaim. If price stays below the old low, the breakdown has not failed. Stages 4 and 5 are not optional.
- The bigger trend wins. A turn on a 5 minute chart can be one more lower high on the daily chart. Check the higher timeframe before calling it a reversal.
- News and thin markets. Around data releases, or in thin overnight trading, footprints get noisy and sweeps can run much further than usual.
The read also tells you where you are wrong: a new low below the sweep low means the turn did not happen.
Seeing it in Sierra Chart
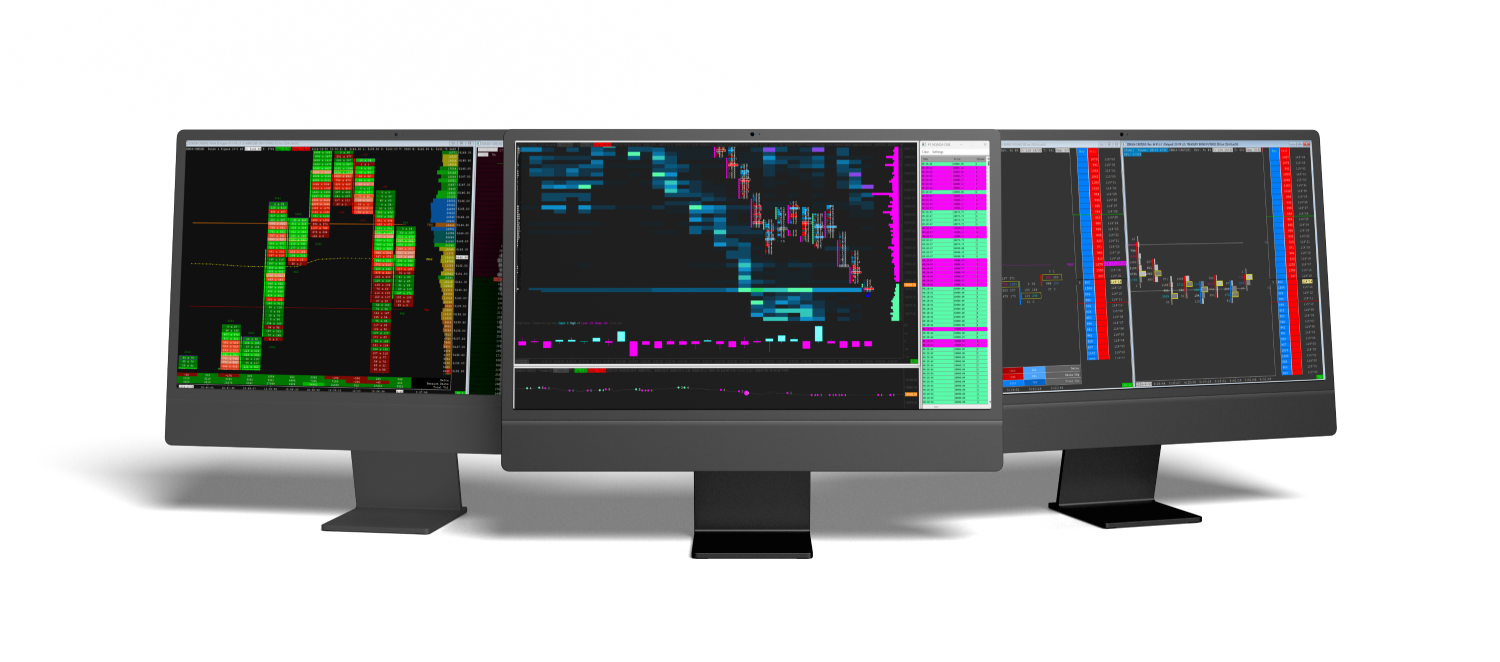
Everything in this article is visible with standard Sierra Chart tools: Numbers Bars set to Bid Vol x Ask Vol, imbalance highlighting, and bar delta. Building and tuning that layout for your market takes time, which is what our footprint chart templates are for.
Spotting absorption and trapped sellers by eye is the hard part. Our Absorption Pack marks them on the chart with Absorption Zones, the Absorption Bar, Trapped Traders and Hammer with Absorption. The Orderflow Suite adds delta studies such as Delta Flips, Delta Divergence and SlingShot. The rest of our studies are in the Sierra Chart indicators collection.
In the next article we turn it upside down: the liquidity grab above an old high, and what the same footprint clues look like when the buyers are the ones who get trapped.
Trading futures involves substantial risk of loss and is not suitable for every investor. This article is education, not trading advice.