




Pullback Into Weakness: How to Read a Weak Rally in a Downtrend

The liquidity grab is the loud way a rally in a downtrend ends: a spike above an old high, a burst of buying, and a quick failure. This article is about the quiet way. No spike, no drama, just a bounce that drifts higher on thin buying until it runs into the sellers who started the last drop. Traders call it a pullback into weakness, and learning to read it comes down to one habit: comparing the pullback with the move that came before it.
What is a pullback into weakness?
In the article on the anatomy of a reversal we said that every bounce in a downtrend is a pullback until structure says otherwise. A pullback into weakness is the most common kind. Price rises against the trend, but the rise is not driven by new buyers who want to own the market. It is driven by sellers stepping aside for a while.
That difference matters because the two kinds of rally behave differently. A rally built on real buying can grow into a reversal. A rally built on missing sellers only lasts until the sellers come back, and they usually come back at a price they have already shown they like.
Why does a downtrend pull back at all?
Markets rarely fall in a straight line, even when sellers are in control. After a sharp drop, a few things happen at once:
- Short term shorts take profit. To close a short you have to buy, so profit taking shows up as buying, even though nobody has turned bullish.
- Bottom pickers try their luck. Some traders buy anything that has fallen fast. Their buying is real, but small and nervous.
- Large sellers pause. A trader who still has a lot to sell does not want to sell it at the low of a fast drop. As we saw in the article on accumulation and distribution, big positions are worked patiently, and a seller would much rather sell into a rally at better prices.
None of that is fresh demand. It is covering, guessing and waiting. So the pullback tends to look tired from the first bar, and that tiredness is what you are trying to read.
Compare the pullback with the drop
The single most useful thing you can do with a pullback is put it next to the move before it. The drop shows you what conviction looks like in this market today. The pullback shows you how much conviction the other side has.

- A downtrend. Lower highs and lower lows set the context.
- The drop. Wide bars, fast, with little overlap. Sellers are aggressive and buyers get out of the way.
- The pullback. Small bars that overlap each other, red bars mixed in with the green, and a slow drift higher. It takes far more bars to climb back than it took to fall.
- The stall. The pullback reaches the area where the last drop started and stops. That is where sellers were active before, and where many of them are waiting again.
- The trend resumes. Price turns down, breaks the low of the drop, and the downtrend carries on.
A quick way to put it: the drop moves easily, the pullback has to work for every tick. When the move against the trend is that much harder than the move with it, the trend is still in charge.
What weak buying looks like on a footprint
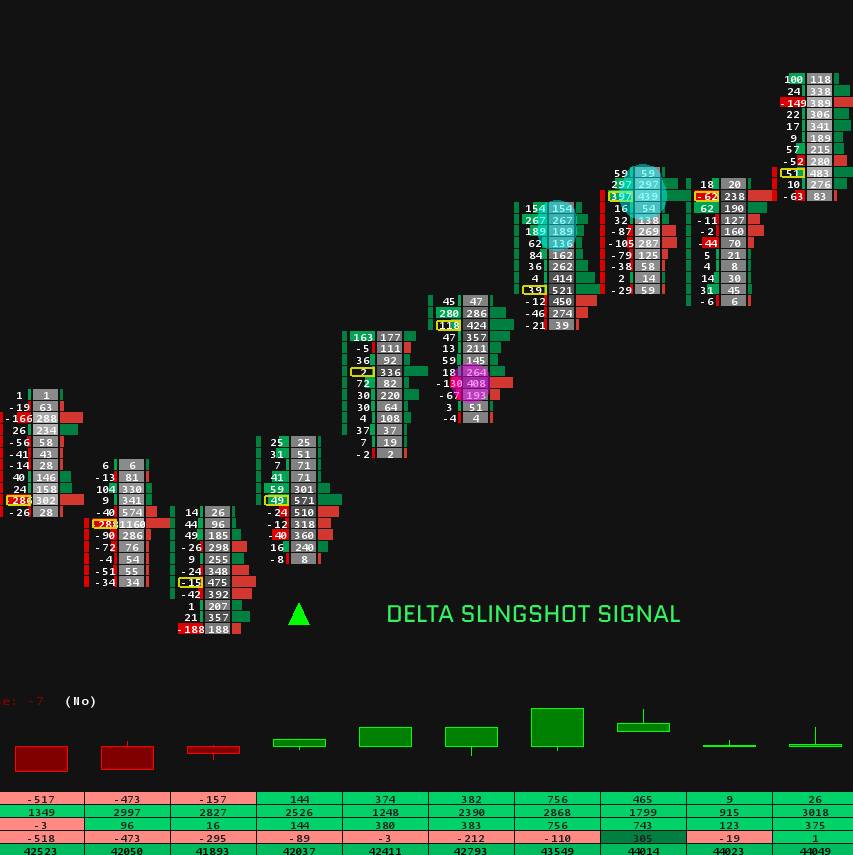
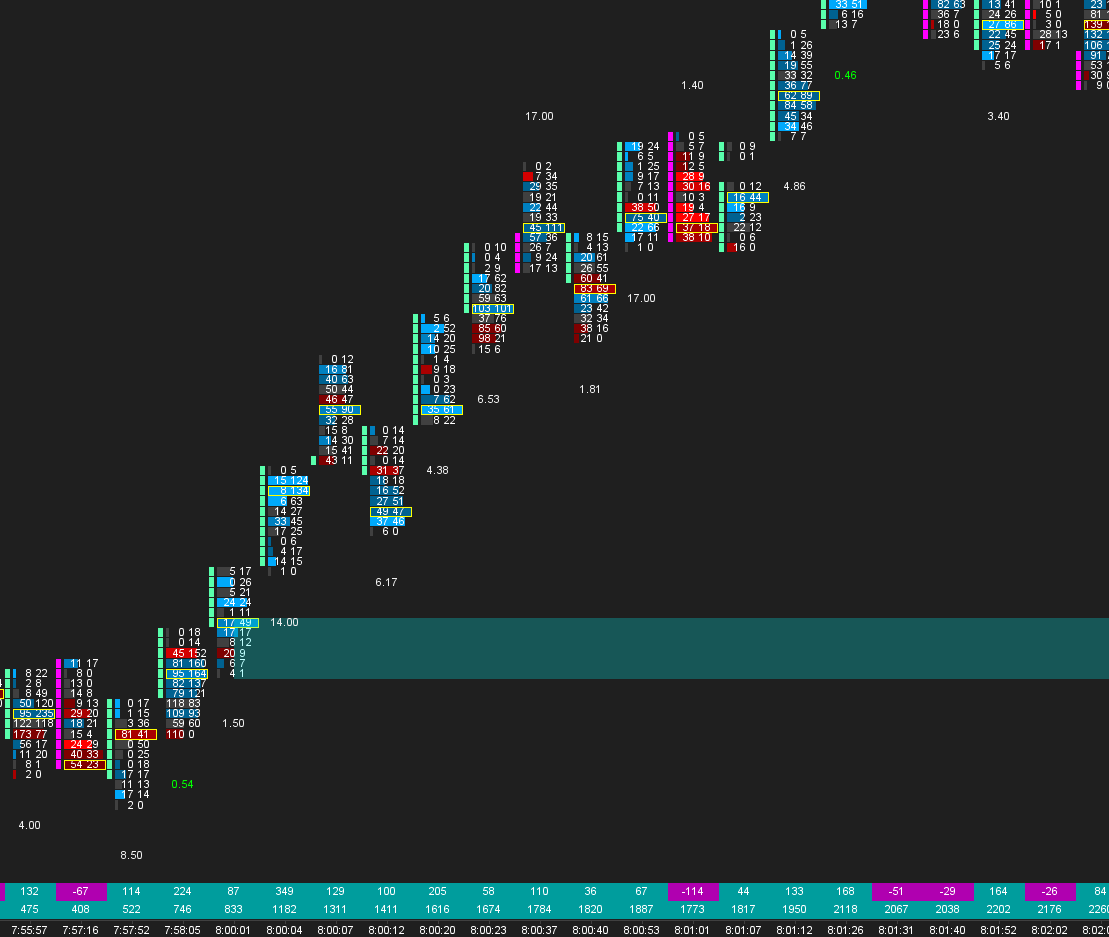
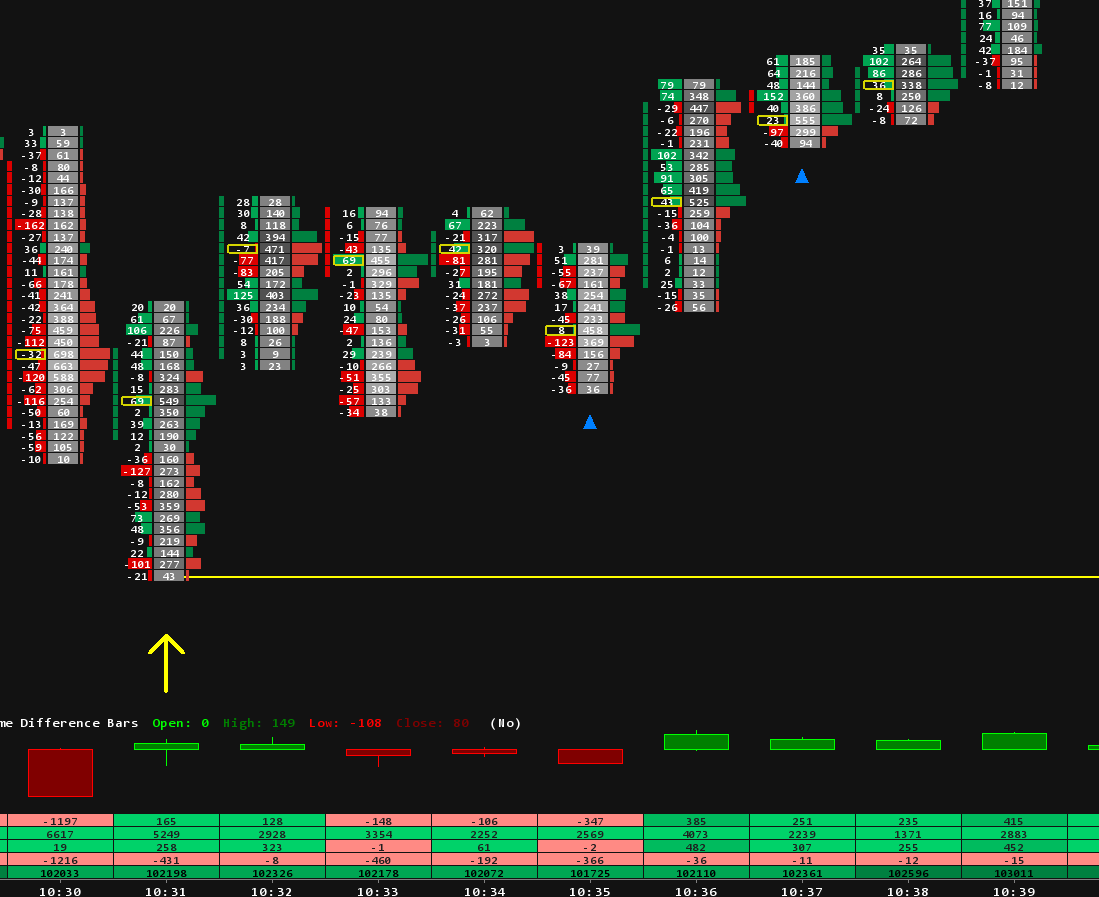
A candle chart shows you the shape of the pullback. A footprint chart shows you who is behind it. In the diagram below, each cell shows the contracts sold at the bid on the left and bought at the ask on the right, bold numbers are imbalances where one side traded at least three times the other on the diagonal, and delta is the buying at the ask minus the selling at the bid. If you have not built one yet, our footprint setup guide walks through it in Sierra Chart.

The drop: bar 1
This is the benchmark. A wide bar, 2,710 contracts, delta minus 1,490, and six stacked sell imbalances down the middle of the bar. Sellers were hitting bids at almost every price on the way down. Remember these numbers, because every bar of the pullback should be measured against them.
The pullback: bars 2 to 4
Bar 2, a weak bounce. Price ticks higher, but on 452 contracts, exactly a sixth of the drop's volume. Delta is plus 52 and there is not a single buy imbalance. Buyers are not lifting offers with any urgency.
Bar 3, still weak. The bar overlaps the one before it and closes only half a point higher. Volume is lower again, 384 contracts, and delta is barely positive. The rally is moving because nobody is selling, not because anyone is buying hard.
Bar 4, into the zone. Price reaches the area where the drop started, and this is the first bar with real buying: 550 contracts bought at the ask at the two highest prices. And it goes nowhere. The bar closes a full point under its high. When aggressive buying of that size cannot push price higher, someone is selling into it with resting offers. It is the mirror image of the absorption at a low that we saw in the reversal article.
Sellers return: bars 5 and 6
Bar 5, sellers step in. Three stacked sell imbalances, delta minus 655, and a close on the low. The sellers who were waiting above the market have started hitting bids again.
Bar 6, the new low. Price breaks the low of the drop at 6,043.00 with four stacked sell imbalances and delta minus 730. The pullback is over and the downtrend has resumed. The whole pullback climbed three and a half points in three bars; sellers took it back in two.
Where do pullbacks tend to stall?
Weak pullbacks often stop at prices where sellers have already shown themselves. A few areas are worth marking before the pullback gets there:
- Where the last drop started. The top of the impulse, where aggressive selling first came in.
- The previous lower high. The last swing high of the downtrend. If the pullback cannot get past it, the run of lower highs is intact.
- Old support that broke. A level that held price up before the drop often acts as a ceiling on the way back.
- A high volume area from the drop. A volume profile over the decline shows where most of the selling took place. Our volume profile templates make that easy to see.
These are areas to watch, not prices that must hold. What matters is how price behaves when it gets there.
When a pullback is not weak
Sometimes the bounce is the start of something bigger. The same comparison that shows weakness also shows strength, so watch for the opposite signs:
- The pullback moves as fast as the drop, with wide bars and little overlap.
- Volume rises as price rises, instead of fading.
- Buy imbalances stack up and delta keeps growing.
- Price pushes through the zone where the drop started and holds above it, the way a real breakout is accepted in the liquidity grab article.
- A higher low forms on the next dip.
When several of these show up together, stop treating the move as a pullback. It may be the turn described in the reversal article.
Where this read goes wrong
- No trend, no pullback. In a sideways market there is no trend to resume, and every bounce looks weak and strong in turn. The idea only works when the trend is clear.
- The stall comes higher. A weak pullback can still run through the first zone and stall at the next one, sometimes with a liquidity grab on the way. Weak buying tells you who is in control, not the exact price where it ends.
- News. A data release can turn a quiet pullback into a fast one in seconds. The read assumes a normal trading session.
- Timeframes. A pullback on a 5 minute chart can be the first leg of a reversal on the hourly chart. Know which trend you are reading.
The idea is wrong if price climbs through the zone and holds above it, or makes a higher low after the break. At that point the sellers had their chance and did not take it.
Seeing it in Sierra Chart
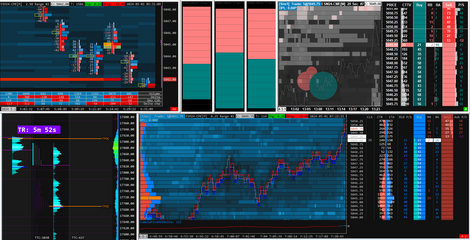
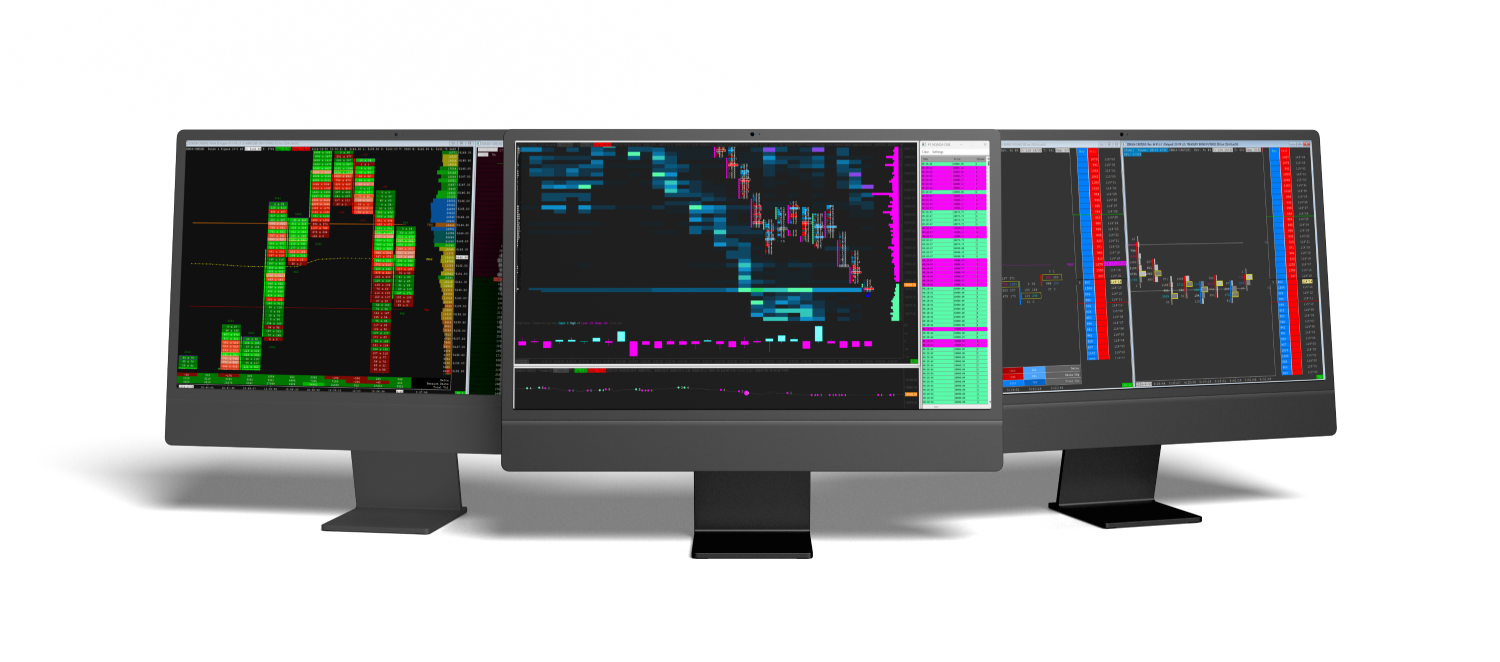
To read a pullback this way you need three things side by side: the candles for speed and overlap, the footprint for imbalances and delta, and a profile for the zones. Our footprint chart templates put the footprint and delta together in one layout.
The absorption at the top of the pullback, aggressive buying soaked up by resting sellers, is the hardest part to catch live. Our Absorption Pack marks it on the chart with Absorption Zones, the Absorption Bar, Trapped Traders and Hammer with Absorption. The Orderflow Suite adds delta studies such as Delta Flips and Delta Divergence. The rest of our studies are in the Sierra Chart indicators collection.
That completes this series: how large traders build a position, how a downtrend turns, how a liquidity grab traps buyers above an old high, and how a weak pullback hands control back to the sellers. All four come down to one habit: compare the effort with the result. Heavy selling that gets nowhere, heavy buying that gets nowhere, a rally that has to work for every tick. When effort and result stop matching, the market is telling you something.
Trading futures involves substantial risk of loss and is not suitable for every investor. This article is education, not trading advice.