




How Big Players Build a Position: Accumulation, Markup and Distribution

Picture a fund that needs to buy a position far larger than anything resting on the order book. If it sent one market order, it would sweep through offer after offer and pay a worse price on every fill. So it does what every large trader does: it works the order slowly, buying in pieces over hours or days, and lets other people's selling come to it. That patience leaves a trail on the chart. Once you know the phases a big position goes through, accumulation, markup, distribution and markdown, a lot of price action that looked random starts to have a reason.

Why can't a large trader just buy everything at once?
Because there is not enough on the other side. At any moment the order book holds a limited number of contracts at each price. A small trader never notices; a large one uses up the best prices in seconds and then pays up for the rest. Worse, a sudden wave of buying tells everyone watching the tape that someone big is in, and they get ahead of the rest of the order.
So a large buyer splits the work. Part of the order rests as limit bids below the market, waiting for sellers to hit them. Part goes in as market orders when an opportunity appears. The result is buying that is spread across a price range and across time. That spread is what creates the phases below.
Phase 1: accumulation, building the position in a range
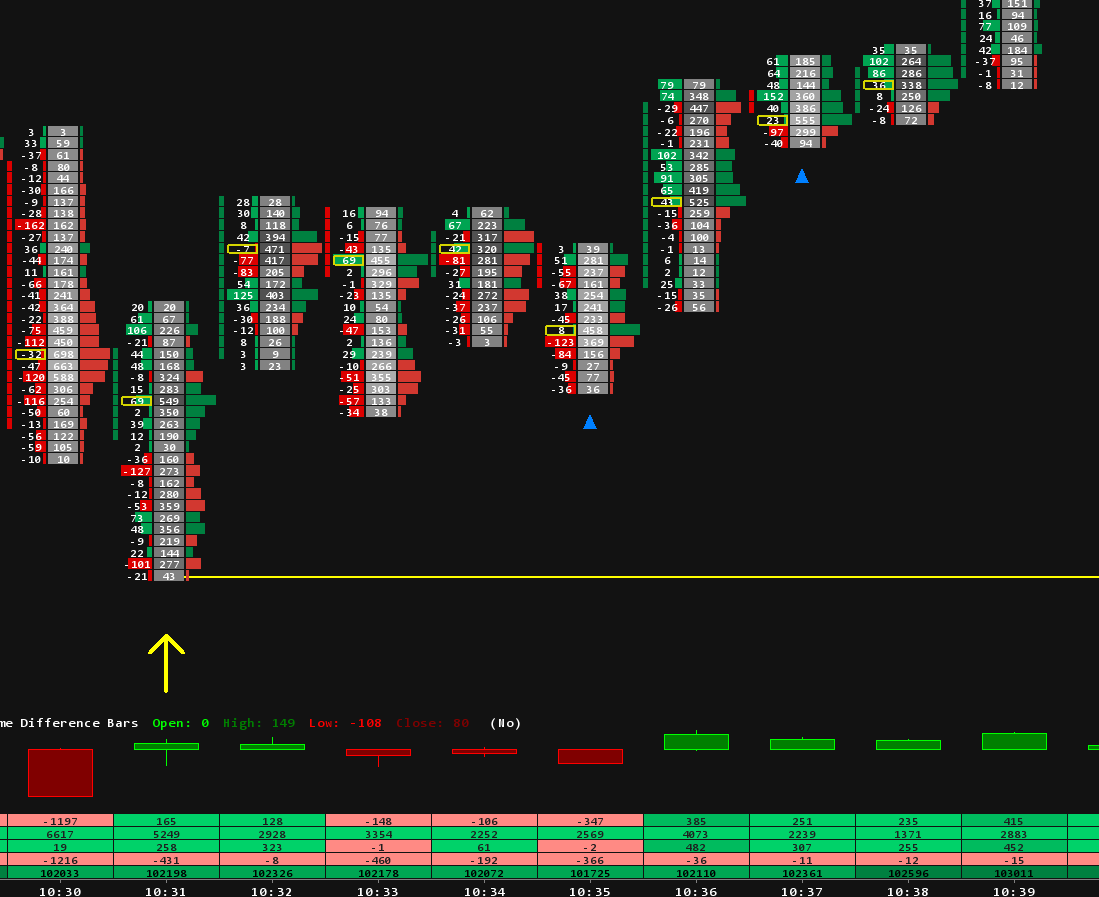
Accumulation usually follows a decline. Selling is still going on: late shorts pressing, longs getting stopped out, holders giving up. For a patient buyer, that selling is exactly the liquidity they need. Every aggressive sell order that hits their resting bids fills part of their position at a good price.
The building rarely happens in one go. A typical sequence looks like this:
- A first probe. A small buy to see how the market reacts and how much is available.
- Adding on weakness. More buying as price makes lower lows, because that is when sellers are most willing.
- Building the core. The bulk of the position goes in around a support area. Sellers keep hitting bids there, yet price stops going lower. That is absorption: aggressive selling met by passive buying big enough to soak it up.
- The position is in. The average entry sits inside the range, so the buyer has every reason to defend it.
On the chart, this shows as a sideways range after a downtrend. Lows stop extending, sell volume at the bottom of the range gets no follow through, and the range can last far longer than anyone expects. That patience is the point.
How a downtrend ends: when price can no longer fall
A downtrend does not end because price is low. It ends when the trend itself starts to break down, and that shows in the way price moves well before the low is obvious. This is where the large buyer is working, and it is the part of the chart most traders misread.
- The selling loses force. Clean, aggressive drives lower turn into choppy, overlapping bars. Each new push down covers less ground and gets less follow through than the one before.
- Selling stops working. Heavy sell volume prints, yet price barely reacts. Someone is taking the other side of that pressure: that is absorption.
- The trend tries one more time and fails. Price makes a new low or runs the stops under the previous low, then snaps straight back into the range. This is the failed breakdown, and it is not just weakness. The market did exactly what it needed to do to continue lower, and it did not work.
- The other side responds. Buyers step in aggressively after the failure, and structure starts to shift. The first higher low forms where every pullback used to make a lower one.
So you do not look for a reversal where the market is falling. You look for it where the market can no longer fall, even though it should. Repeated failure to continue, together with a faster and stronger response from the other side, is what turns an ordinary pullback into a possible reversal.
Phase 2: markup, when supply runs out
A range ends when one side runs out. The failed breakdown is often the last act: the final sellers are flushed out under the range low, nobody follows them, and once they are done there is nothing left to absorb. Price has to go higher to find new sellers. That is the breakout.
A few things tend to happen in this phase. Price often comes back to test the top of the old range, which now acts as support, and the large buyer may add there. The trend then builds higher highs and higher lows as more participants join. Late in the move there is often a fast, emotional push higher as breakout traders chase and shorts cover. That push is not the large buyer's signal to buy more. It is their chance to start selling.
Phase 3: distribution, scaling out into strength
A large position is just as hard to sell as it was to buy. Dumping it in one go would push price down against the seller, so the exit is worked as carefully as the entry, in reverse. The seller needs buyers, and the easiest time to find them is when everyone is excited.
- A first trim into the fast push higher, while buyers are eager and paying up.
- More selling as price stalls and fails to make new highs.
- Selling at the top of a new range, into breakout traders and late longs.
- The last of it as the range finally gives way.
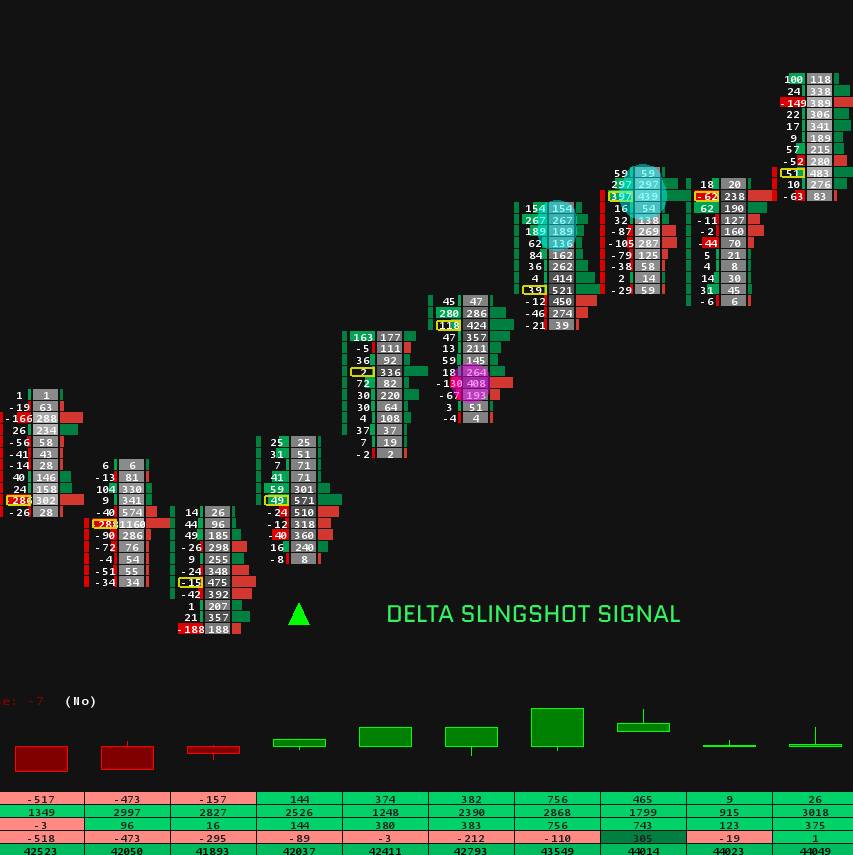
Distribution is the mirror image of accumulation. On a footprint chart you see aggressive buying at the highs, buyers lifting offers again and again, and price still not going higher. That buying is being absorbed by a seller who is happy to hand the position over.
Phase 4: markdown, and the cycle starts again
When the seller is done and demand dries up, the range breaks down. Price falls until it reaches levels where new buyers are willing to step in, and those buyers may be the next large trader starting their own accumulation. The cycle repeats on every timeframe, from a single session to several months.
It is never just one trader
The big player picture is a simplification. A market is thousands of participants with different timeframes, sizes and reasons to trade. A range is simply where buying and selling come into balance for a while, and a trend is what happens when that balance breaks. The phases describe where the pressure sits, not a secret plan run by one fund.
There is an honest catch too: you only know for sure that a range was accumulation after it breaks higher. A range after a decline can just as easily be a pause before the next leg down. That is why the phases are a way to read context, not a signal on their own.
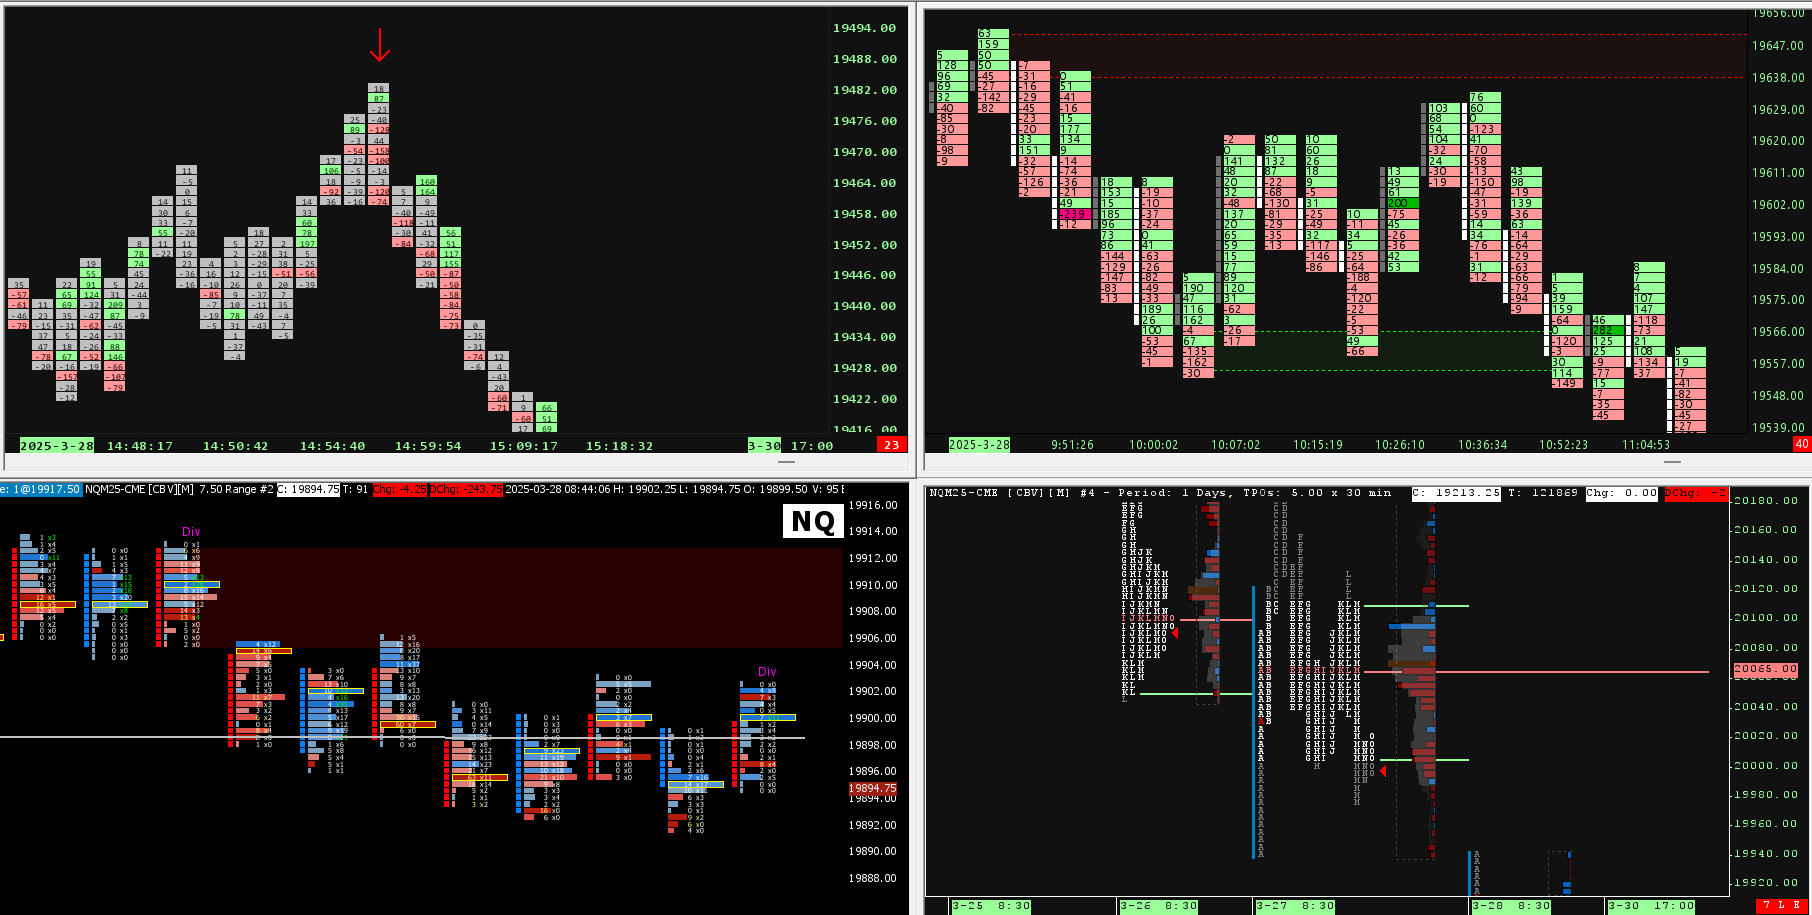
How to see the phases in Sierra Chart
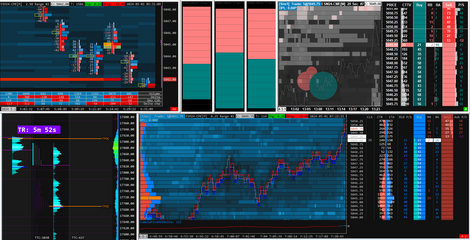
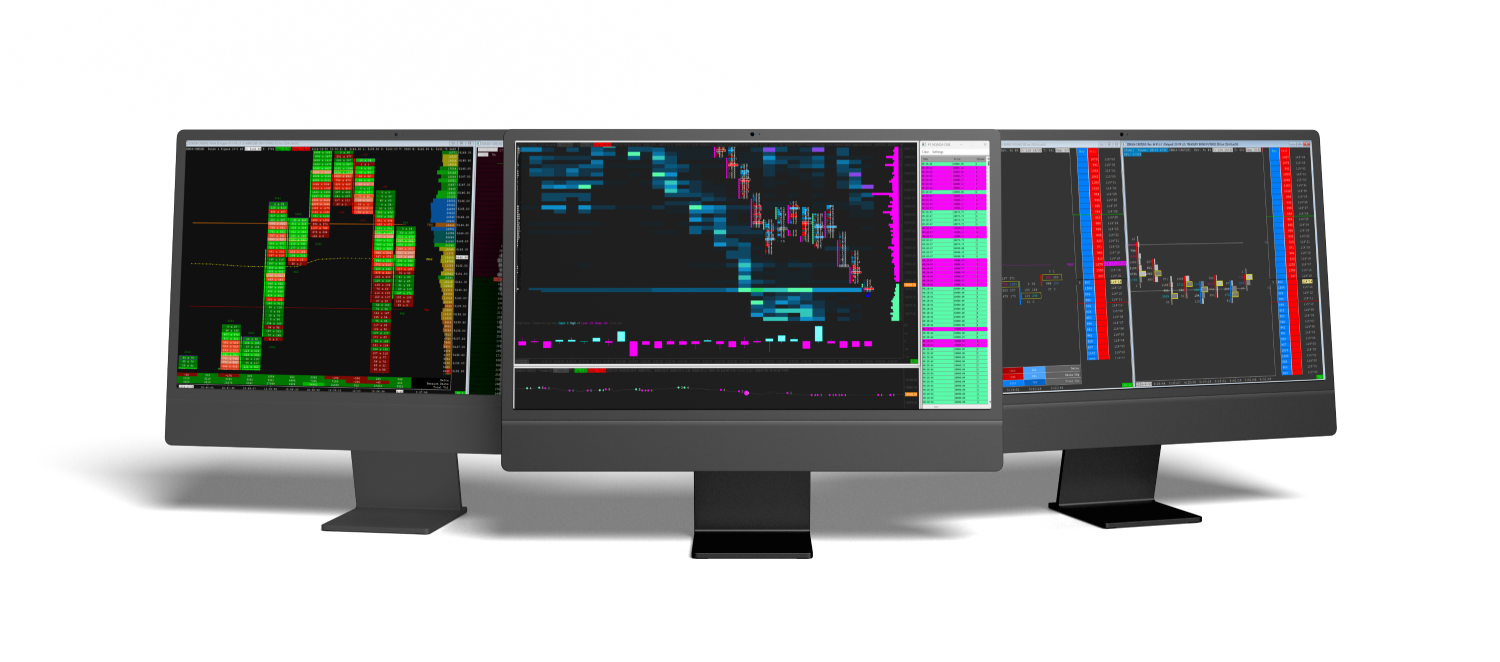
Three views make these phases far easier to read than candles alone.
- Volume profile. Put a volume profile over a range and you see where most of the trading happened. A thick high volume node inside the range shows where positions were built. The thin, low volume gaps between ranges are what our supply and demand zones mark: prices the market moved through quickly during markup or markdown. If you would rather start from a ready-made layout, see our volume profile templates.
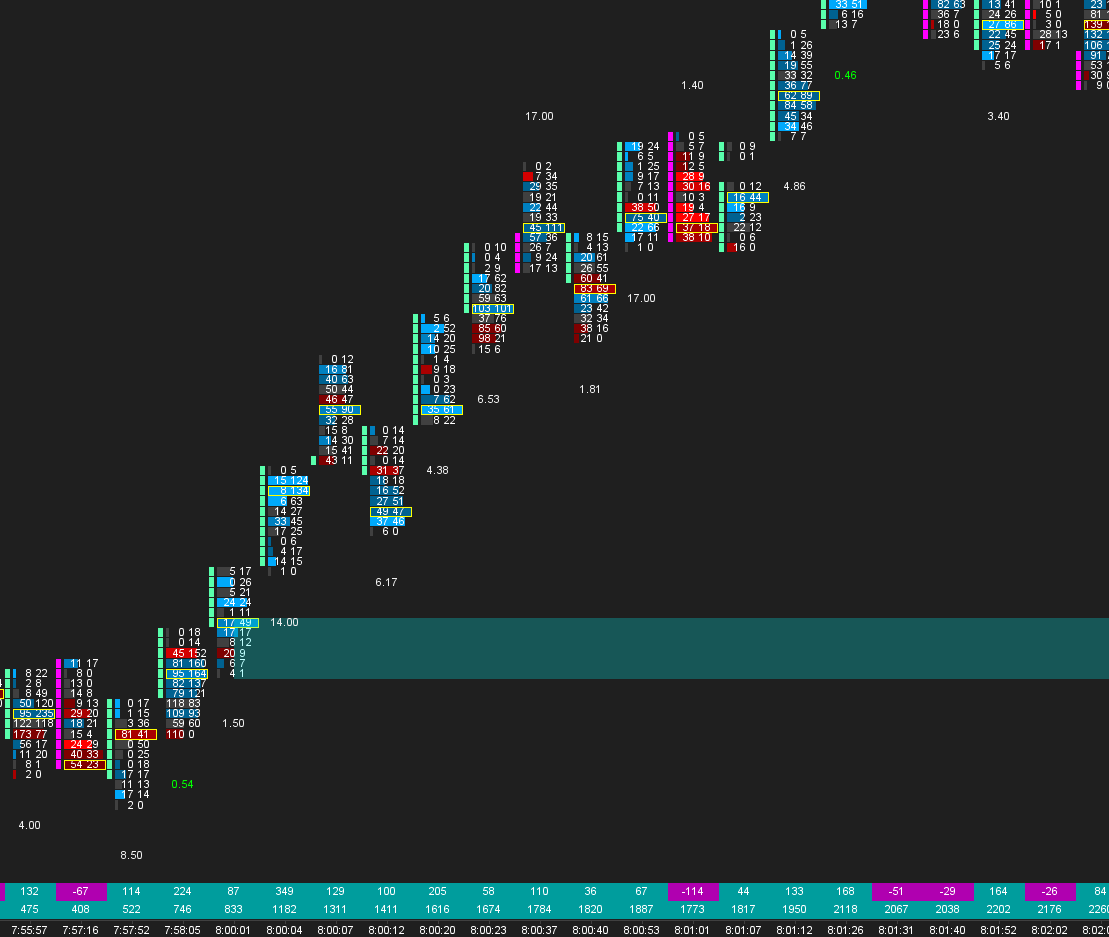
- Footprint chart. Absorption is visible at the bid and ask level: large sell volume at the range lows with no new low, or large buy volume at the highs with no new high. If you have never built one, follow our footprint setup guide.
- Market Profile. Balance shows as a wide, rounded profile, and a trending move as a long, thin one. Our Market Profile guide walks through the setup.
Spotting absorption by eye takes screen time. Our Absorption Pack marks it on the chart for you with Absorption Zones, the Absorption Bar, Trapped Traders and Hammer with Absorption. The rest of our studies are in the Sierra Chart indicators collection.
Using the model without fooling yourself
The most useful question this model gives you is a simple one: which phase am I probably in? Buying the lows of a range is buying where a large buyer may be building, but only if the range holds. Chasing the fast push at the end of a trend is often buying from someone who is selling. A few habits keep the model honest:
- Wait for the market to show its hand, for example a failed breakdown that comes back into the range, rather than guessing at the bottom.
- Know where you are wrong. If you trade from the edge of a range, a clean break of that edge means the read was wrong.
- Check the higher timeframe. Accumulation on a 5 minute chart can sit inside distribution on a daily chart.
In the next article we take the turning point apart on a footprint chart: what the flush below the low, the absorption and the first higher low look like bar by bar.
Trading futures involves substantial risk of loss and is not suitable for every investor. This article is education, not trading advice.