


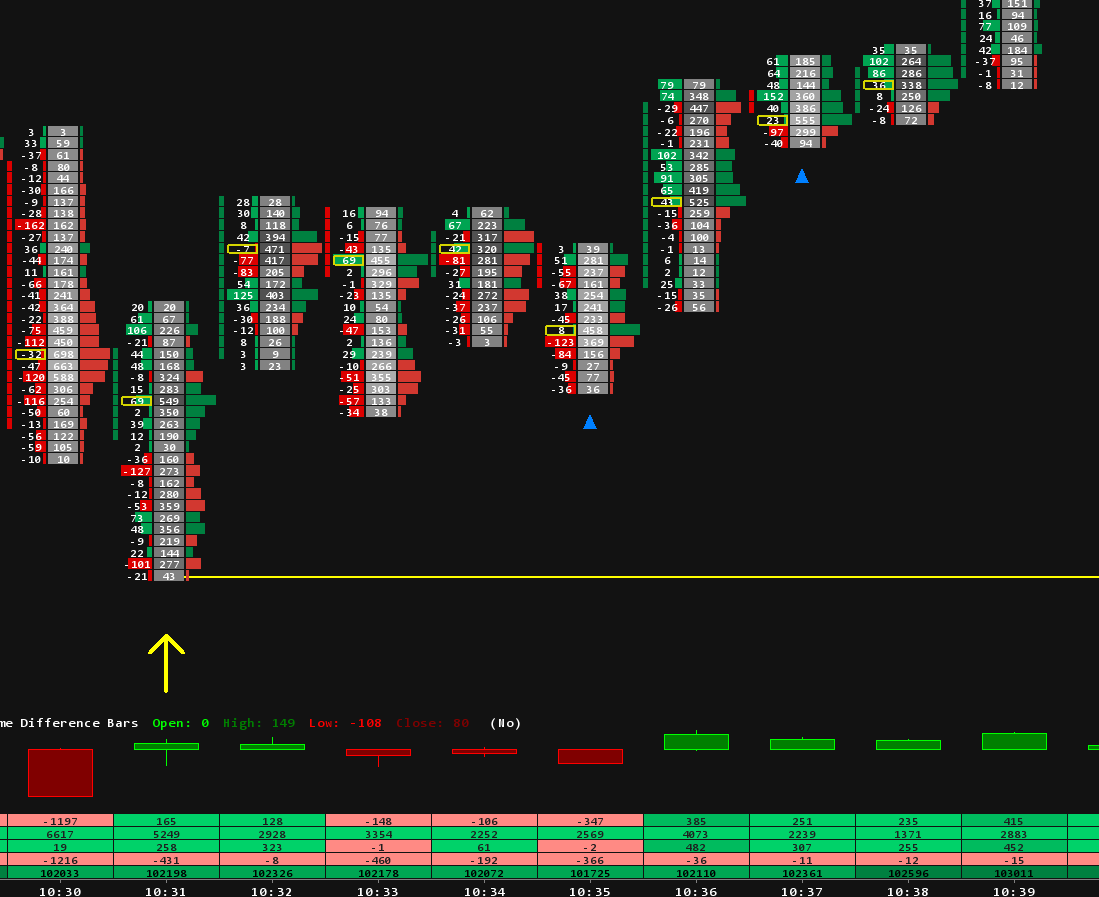
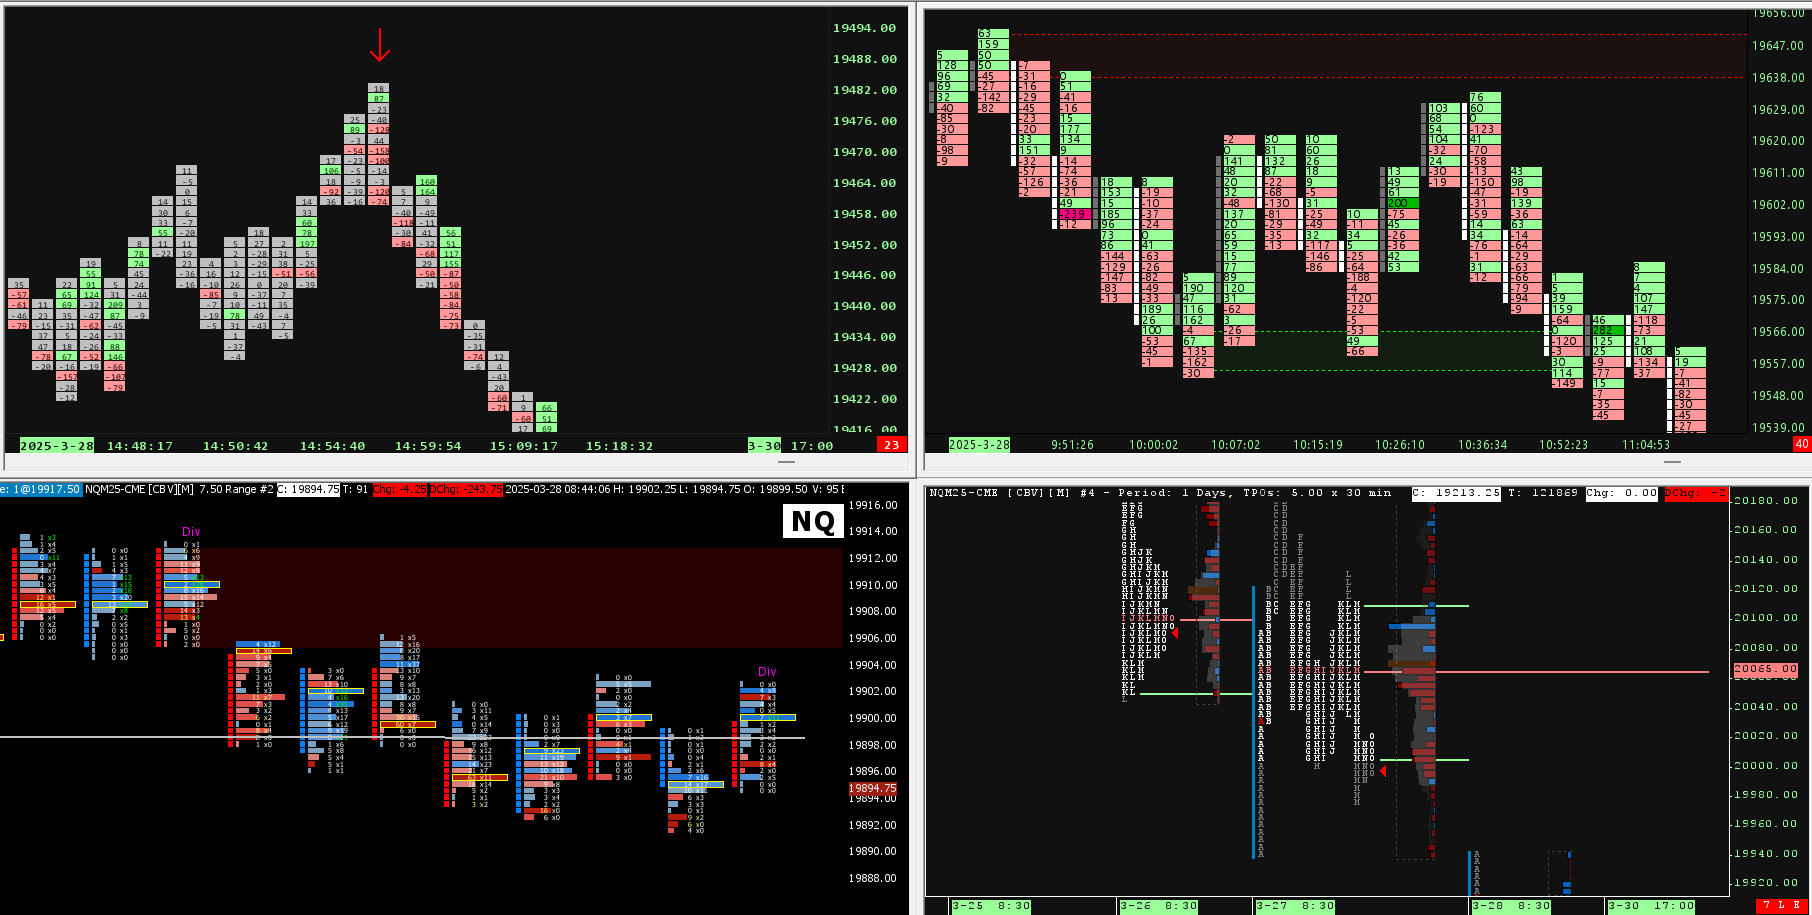


Sierra Chart Delta Profile: Volume and Delta Side by Side

If you read order flow in Sierra Chart, you know its Volume by Price study. It shows where the market traded over a range of bars, and it shows delta too, inside the volume bars: as a color, or as a number written in the bar. One thing was missing: a split view, with volume on one side of a line and delta on the other, on one chart, for a range you pick. That is why we built Split Delta Profile. This article shows what Sierra Chart's own profile gives you, what the split view adds, how to draw a profile with two clicks, and how to read its delta clusters.
What Sierra Chart's own volume profile shows
The Volume by Price study draws one horizontal bar per price, and the length of each bar is the volume traded there. For the aggressive side, its settings give you two tools. A coloring method paints each volume bar with its bid volume and its ask volume, or colors only the part of the bar that is the difference between them. The Display Volume in Bars setting writes a number in each bar instead, for example Ask Volume minus Bid Volume.
Both keep delta inside the volume bar, in the same space as the volume. What the study does not have is a split view: a separate delta bar for every row, on its own scale, next to that row's volume bar. That was the missing piece, and it is what Split Delta Profile adds.
One more thing to know if you use it: in the Volume by Price study, the first color of the Bid Volume and Ask Volume Colors subgraph is the bid color and the second is the ask color. With green first, it paints buying red. Swap the two colors and green means buying.
So we built it: volume on one side, delta on the other
Split Delta Profile draws a profile for any range of bars you choose and splits it around a middle line. On one side is the delta at each price: the volume traded at the ask minus the volume traded at the bid. On the other side is the total volume at each price. Every row shows both numbers for the same price. By default delta is on the left and volume on the right, and delta has its own scale: the biggest delta row of the profile fills the whole delta side, so the strongest rows are easy to find.

The profile on the left covers a rally: Vol 52.1K, Delta +4052, with three buyer clusters boxed in green. The one on the right covers a drop: Vol 285.9K, Delta -11.7K, with three seller clusters boxed in red. Each profile is drawn just before the bars it covers, marked by a blue rectangle, so the candles stay in view, and the zones of the clusters run on to the right.
Reading volume and delta on the same row
With both numbers on one row, three cases come up again and again. The diagram shows one of each, on an example profile.

- Big volume, strong delta. At 6,052.00, 2,880 contracts traded: 2,010 bought at the ask and 870 sold at the bid, a delta of plus 1,140. Buyers were the aggressive side, and enough sellers were resting there to fill them. What price did next shows who won that exchange. If it went higher, the buyers did. If it stalled, passive sellers took everything the buyers sent, the pattern from our absorption lesson.
- Big volume, delta near zero. At the POC, 6,048.00, 4,380 contracts traded and delta is only plus 40. Both sides kept doing business there, more than anywhere else in the range, and many traders read a price like this as fair value.
- Thin volume, strong delta. At 6,043.00 only 520 contracts traded, but delta is minus 380. Sellers pushed through this price fast, and little business was done on the way.
On a plain volume profile, the first two rows look alike: two long bars. The third is just a short bar. The delta side is what tells them apart.
How to draw a profile: right-click, two clicks
- Right-click the chart and choose Split Delta Profile: New (click 2 bars). A banner at the top of the chart asks for the first bar.
- Click the first bar of your range, for example the open or the start of a move.
- Click the last bar. The profile appears, with its POC, value area, totals and delta clusters.
Draw as many as you want: one per session, one per swing, one per news move. To follow the market as it trades, choose New to Live Bar (click 1 bar) and click one bar. The profile runs to the newest bar and keeps growing with every trade, on a live chart or in Chart Replay. The same menu has Delete, Clear All and Cancel, and Esc cancels a choice that is still waiting for a click.

Here is a live profile. The totals above it read Vol 35.1K and Delta -7: over the whole range, buying and selling almost cancel out. Yet two seller clusters are boxed, one at the POC and one just above it, both between the yellow VAH and VAL lines. At the most traded prices of the range, sellers were the more aggressive side. A plain volume profile would show only the shape.
Profiles are saved by date and time for each symbol. They come back after a restart, cover the same time on every bar period, and can be shown on your other charts of the same symbol with one setting.
Delta clusters: where one side dominated
One strong row can be a single large order. Several rows in a row with delta on the same side show one side pushing across a whole zone of prices. That is a delta cluster, the same idea as the stacked imbalances on a footprint, measured over a whole profile instead of inside one bar.

In the example, the buyer cluster is two big rows, 6,051.00 and 6,052.00, with a total delta of plus 2,120. The seller cluster is five rows from 6,041.00 to 6,045.00. None of them is big on its own, but all five lean the same way, for a total of minus 1,600. The delta of the whole profile is only plus 260, so the total looks balanced. The clusters show where each side was aggressive.
Split Delta Profile finds the clusters for you, with three detection modes:
- Big Delta: big rows on one side, close together, where one side hit hard. The default.
- Same-Side Run: many rows in a row on one side, even small ones, where one side kept pushing.
- Run + Big Delta: a same-side run with big rows inside, where the push lasted and was strong.
Each cluster gets a box with its total delta beside it, and its price zone runs to the right: to the right edge of the chart, or until price trades in the zone again. When price comes back to a zone for the first time, traders look at which side shows up: the same side again, the other side stopping price there, or price going straight through on little volume. The return does not decide anything by itself, but it shows who is still active at those prices.

This profile has two buyer clusters and one seller cluster, each with its total delta beside the box and its zone running to the right.
The POC, the value area and the lines that carry on
Each profile shows its point of control (POC), the price with the most volume, and its value area: the prices around the POC that hold 70% of the volume, from the value area high (VAH) to the value area low (VAL). The POC, VAH and VAL can carry on to the right as dashed lines, and each one stops on the first later bar that trades at its price. A line still running to the right edge marks a level price has not been back to.
Delta adds the side to these levels. A POC with delta near zero, like 6,048.00 in the first diagram, is a balanced price. A POC with strong delta means the most traded price of the range was also one-sided. Strong buying just above the VAH, or strong selling just below the VAL, shows one side was aggressive outside the main trading area of the range.
The range you choose changes the profile
A profile only describes the bars it covers. Move the first or the last bar and the POC, the value area, the clusters and the totals can all change.

On the left is the whole range from the first diagram: POC 6,048.00, total delta plus 260. On the right are only its last bars, the fast drop at the end: POC 6,043.00, total delta minus 1,900. Neither profile is wrong. They answer different questions, which is why Split Delta Profile lets you draw a profile on exactly the bars you want: a session, a swing or a news move.
What you need
- Tick data for delta. Delta needs the bid and ask volume of every trade. In Sierra Chart, set Intraday Data Storage Time Unit to 1 Tick, as shown in our footprint setup guide. Without it, the volume side still works, but delta is 0 at every price.
- Volume at price data. The study turns it on by itself. The first time you add it, the chart reloads once.
- Your Sierra Chart username. After purchase, you email it to us and we activate the study on your account. It then appears in your custom studies list, and a full user guide comes with it.
Where to get it
A profile or a cluster shows where volume and aggression were concentrated over the bars you chose. It is not an entry, and it does not say what price will do next. How you act on it, where you place risk and what else has to agree remain your decisions.
Split Delta Profile is a one-time purchase with lifetime updates and seven color schemes, including Daylight for white charts. More ready layouts are in our Sierra Chart volume profile templates and footprint chart templates, and the rest of our studies are in the Sierra Chart indicators collection.
Trading futures involves substantial risk of loss and is not suitable for every investor. This article is education, not trading advice.