




Before you leave...
Check our Sierra Chart Suite PRO
Custom Study for Sierra Chart


The classic Market Profile playbook, the one in the books and the articles, turned into code: five Sierra Chart studies that read your TPO chart live, weigh each reading by how your own market has behaved, and say it in plain words. Nothing to calibrate.
Sierra Chart builds the TPO profile. Everything after that, the reading, the weighing, the housekeeping, was still done by hand. This suite is the part that was missing.
Open, acceptance, initial balance, day type, value, one-timeframing, tails, naked POCs, shape, rotation, POC migration, volume. The dashboard reads all of them, every letter, so none is skipped when it matters.
The score comes from the readings and from how they played out on your own chart. It shows the profile's lean before you decide, says when structure and flow disagree, and goes quiet when the market is balanced.
Sierra extends singles and POCs. It does not say which single prints are support, which POC is still naked and nearest, whether the last five sessions form a balance, or what today did against it. Those are the other four studies.
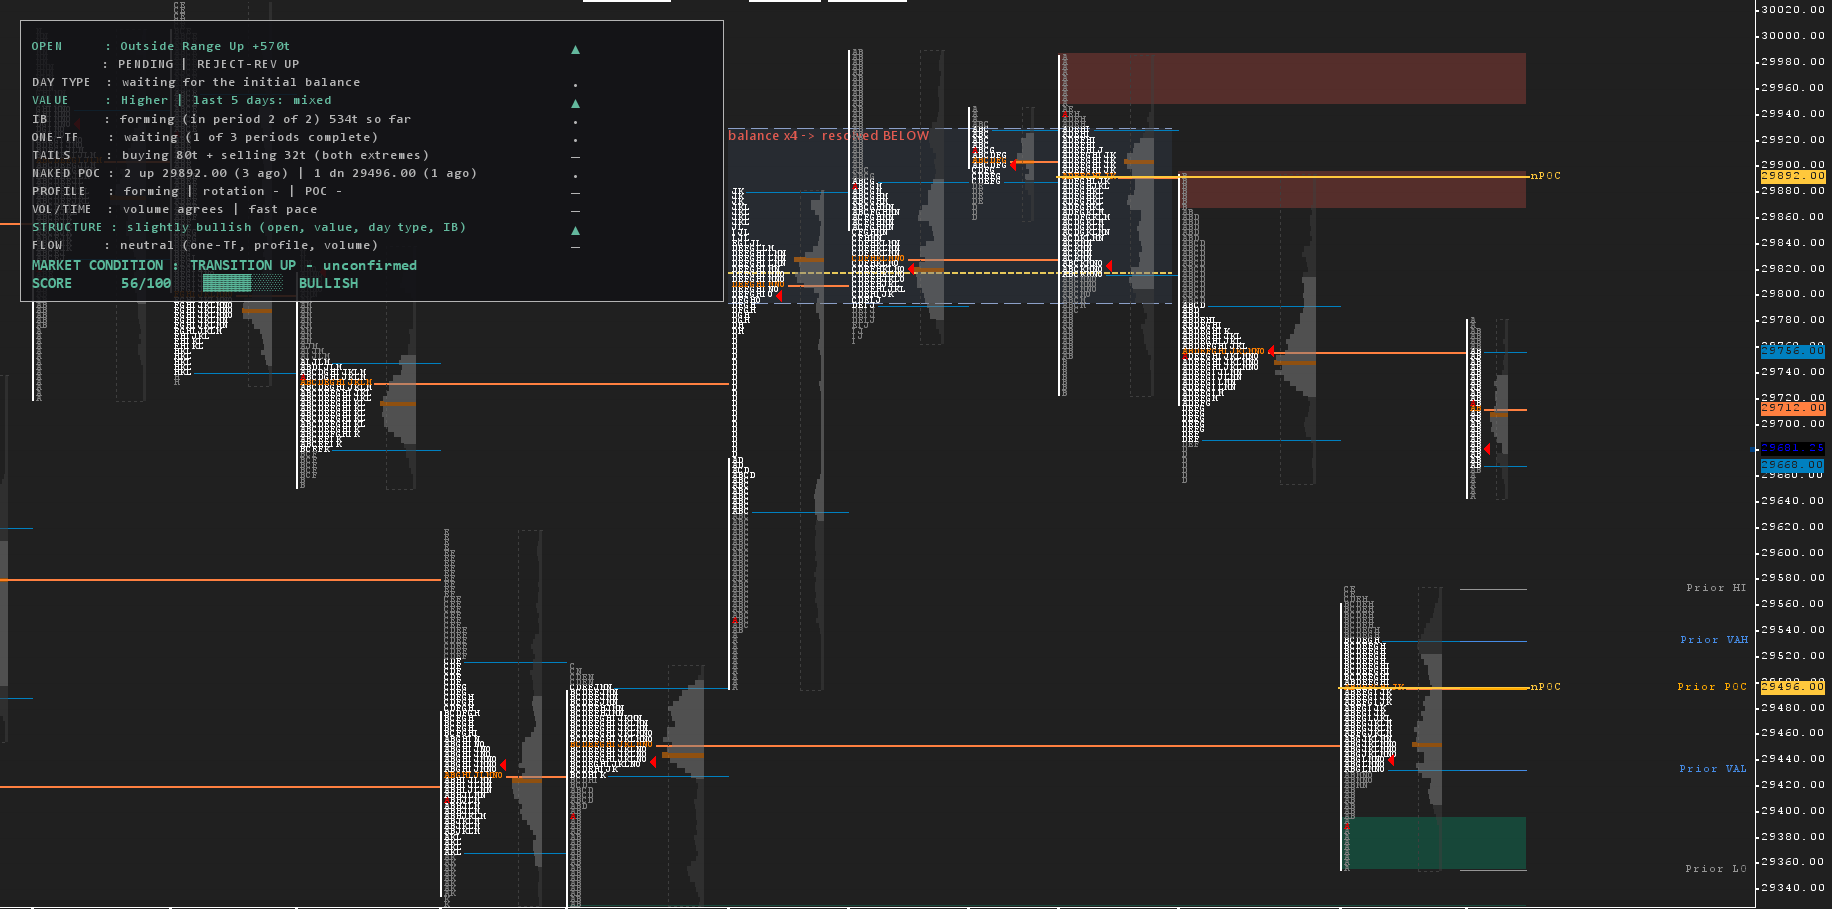
The dashboard sits in a corner and reads the session row by row, one word and one glyph each, with a conviction score underneath. Zones, prior levels, naked POCs and balance areas are drawn on the profile itself, and they retire themselves when the market deals with them.
All of it on your TPO chart, plus an intraday chart of the same symbol for the exact initial balance. Tap any image to enlarge it.
Where the market opened against yesterday's value and whether it held. How big the initial balance is and which way it broke. What kind of day is forming, where value is moving, whether the auction is one-timeframing. Updated every few seconds from the profile itself.
A reading that has led somewhere on your instrument counts for more than one that has not. The weights come from your chart's own completed sessions, and they are remeasured as sessions are added.
Each row gets one word and one glyph. The measured rows add up to a conviction score, and the panel says balanced, transition or directional before it says anything else. On a balanced day the score is muted, because on a range day its direction is noise.
Every Market Profile tool asks you for the same numbers. How many ticks make a large gap. How narrow is a narrow initial balance. How close two value areas must be to count as unchanged. Each answer is right for one instrument at one letter size, and wrong the moment you change either.
Market Profile Copilot does not ask. It measures your chart's last sixty completed sessions and derives them, and it measures how each reading fared on those sessions to decide how much that reading is worth.
Measured from your chart's own day ranges. A gap that is large on ES is small change on NQ, and the suite knows which chart it is on.
How close two value areas must sit to count as the same is a fraction of your profile's own row height, not a number of ticks.
Narrow and wide are ranked against your last twenty sessions, so the reading moves when your market changes and never needs a tick count.
Put it on another market and it measures that market. Nothing to retype.
Add the ones you want. Each reads the TPO study on its chart, and nothing has to be wired between them.
| Study | What it draws | Needs |
|---|---|---|
| TPO Single Print Zones | The single print runs of every completed profile as support or resistance zones, extended until a later session trades into them and repaired one bite at a time. | The TPO study |
| MP Prior Profile Levels | POC, value area, extremes, midpoint, close, initial balance and VWAP of the last sessions, labelled, up to six sessions back. | The TPO study, plus the intraday chart for the exact initial balance |
| MP Session Dashboard | The developing cash session row by row, a bias glyph on each, the condition, and a conviction score. Plain or expert wording. | The TPO study and the intraday chart |
| MP Composite Detector | Multi-session balance areas with their composite value and POC. Today judged as in balance, a failed look, or a breakout. | The TPO study |
| MP Naked Levels | Every untouched session POC as a line until the market comes back to it, the nearest one on each side emphasised. | The TPO study |
The dashboard is the one to start with. The other four are there when you want the drawing, not the sentence.
No thresholds to guess. Gap size, initial balance size, value tolerance and the row weights come from your chart's last sixty sessions, and move with it.
Reads like a trader talks. One switch swaps the plain wording for the ratios, sequences and percentiles behind each row.
Overnight profiles never pollute a reading. The suite recognises session kinds by their start time, compares cash session to cash session, and warns when a chart runs 24-hour profiles.
The chart stays clean without housekeeping. A naked POC disappears the moment it is touched. A single print zone is repaired one bite at a time, and the filled part is kept lighter so you can see what happened.
Every past balance drawn and tagged. Composite value and POC come from the members' own letters, and a failed look shows how often it traversed on this chart, next to the base rate.
Runs at Sierra Chart's own speed. A compiled C++ DLL that publishes 34 values for Sierra Chart's own alerts and spreadsheets: the score, every row, the session levels, the initial balance.
One ES cash session from the open to the close, 14 April 2026. The dashboard filling in as the letters print, the levels and zones on the profile. Sped up in places, nothing cut.
This is the dashboard's whole dialog. Point it at the TPO Profile Chart study, give it the number of your intraday chart, and you are done. The rest is housekeeping.
Colours live where they belong: as inputs on the studies that draw shapes, and in Sierra Chart's own Subgraphs tab on the two that draw lines.
ES, NQ, YM, RTY, GC, CL and ZN, each with the TPO Profile Chart study set for that instrument's own cash session, the intraday chart linked, and all five studies applied and pointed at it. Drops straight into Sierra Chart, already configured. Pick a ticker below to see its chartbook, and tap any image to enlarge it.
The equity index books open at 09:30, gold at 08:20, crude at 09:00. Get those wrong and every reading is wrong. 30-minute letters, a 70% value area, a two-period initial balance.
A 1-minute chart of the same symbol, already numbered into the dashboard and the prior levels.
Referenced, ordered and positioned. The dashboard sits top left in Plain wording.
The letter increment chosen for each market's tick size and range, so the profile reads at a glance.
Enough history for the dashboard to calibrate on from the first open.
Roll to the next contract or switch instruments. The studies follow the chart.
One-time payment. Delivered to your Sierra Chart account. Lifetime updates. No subscriptions, no recurring fees.
Get The Suite Now Ask for your free 7-day trialMarket Profile Copilot is a set of chart analysis studies. They read the TPO profiles on your chart and draw what they find: zones, levels, balance areas and a session dashboard. They do not predict price, and they are not a trading system, financial advice, or a solicitation to trade. The dashboard's score summarises the profile; it is not a trade signal. Futures trading carries substantial risk of loss and is not suitable for every investor. Past chart behaviour does not indicate future results. Requires Sierra Chart with the TPO Profile Chart study on a chart with intraday data; the exact initial balance and the letter based dashboard rows also need an intraday chart of the same symbol.
Important: Make sure you have updated to the latest version of Sierra Chart
After purchasing one of our indicators, please contact us and provide your Sierra Chart username so we can activate the indicator. Once it has been activated, restart your Sierra Chart platform.
Next, open Sierra Chart and the chart where you want to add the indicator:
1. Go to Analysis in the top menu bar.
2. Click on Studies.
3. In the "Studies" window, click Add Custom Study....
4. Find your new indicator in the list , select it, and click Add.
Template included with the indicators:
Copy the template file received by email template.cht into your C:\SierraChart\Data\ folder. Restart your Sierra Chart platform, open the Chartbook
To get the most out of our Sierra Chart templates, you need at least the following subscription:
“Integrated Sierra Chart with Advanced Features (Service Package 5) at 36 USD”.
We also recommend purchasing the “Denali Exchange Data Feed” data source, for access to accurate, professional market data.
(Denali : 11usd with a Stage5 broker account)
Our templates are available as one-time purchases, meaning you pay once and own the template indefinitely. There are no monthly subscription fees associated with our products, allowing you to use them without ongoing costs.
- Be sure to update to the latest version of sierrachart.
- Copy the template file received by Email, template.cht into your \SierraChart\Data\ folder.
- Restart your Sierra Chart platform and open the corresponding Chartbook.
Unfortunately, we do not offer trial versions of our Templates / Chartbooks. However, we provide detailed descriptions and support to help you understand how our templates work and how they can enhance your trading experience.
Yes, we offer 7 days Trial for our indicators, please email us your sierra chart username for activation.
We are committed to providing high-quality templates. Refunds are only issued for verified technical issues with our products. Technical support is available to assist you in resolving any problems you may encounter.
Our team of traders and Sierra Chart experts also offers personalized coaching to help you get started with the Sierra Chart platform.
Our templates are optimized and configured to work on a specific market (NQ, ES, ZN, Gold...). However, if you have advanced knowledge of your market and SierraChart, it is possible to modify the settings to match the characteristics, schedules, etc. of another market.
Thanks for subscribing!
This email has been registered!
| Product | SKU | Description | Collection | Availability | Product Type | Other Details |
|---|