




Sierra Chart Footprint Setup: Build Your First Footprint Chart

By the end of this guide you will have a working footprint chart in Sierra Chart, built from scratch, saved as a chartbook you can reopen tomorrow. Nothing here requires programming, and every step uses menus that exist in a standard installation. Sierra Chart calls its footprint implementation Numbers Bars, and it is one of the most complete versions available on any platform, which is exactly why the first setup can feel intimidating.
What you need before starting
- Service Package 5 or higher. Numbers Bars is included from the Base Advanced package at $36 per month. The Integrated packages 10, 11 and 12 include it as well. You can check and change your package under Help, then Account Control Panel.
- Tick by tick intraday data. Footprints are built from individual trades, so your intraday data must be stored at 1 tick. For CME futures such as ES and NQ, the Denali Exchange Data Feed provides this, and it needs one of the Integrated packages.
- No market depth required. Numbers Bars only needs trades and the best bid and ask, so you do not need the more expensive market by order data for this. The official Numbers Bars documentation is the complete settings reference if you want to go deeper than this guide.
Step 1: store your intraday data at 1 tick
This is the step most first attempts miss, and the reason footprints sometimes show one large number per price instead of a proper bid and ask split. Open Global Settings, then Data/Trade Service Settings, and set the Intraday Data Storage Time Unit to 1 Tick. If your chart was downloaded before this change, delete and re download the data for the symbol so the file is rebuilt tick by tick.

Step 2: choose the bar period
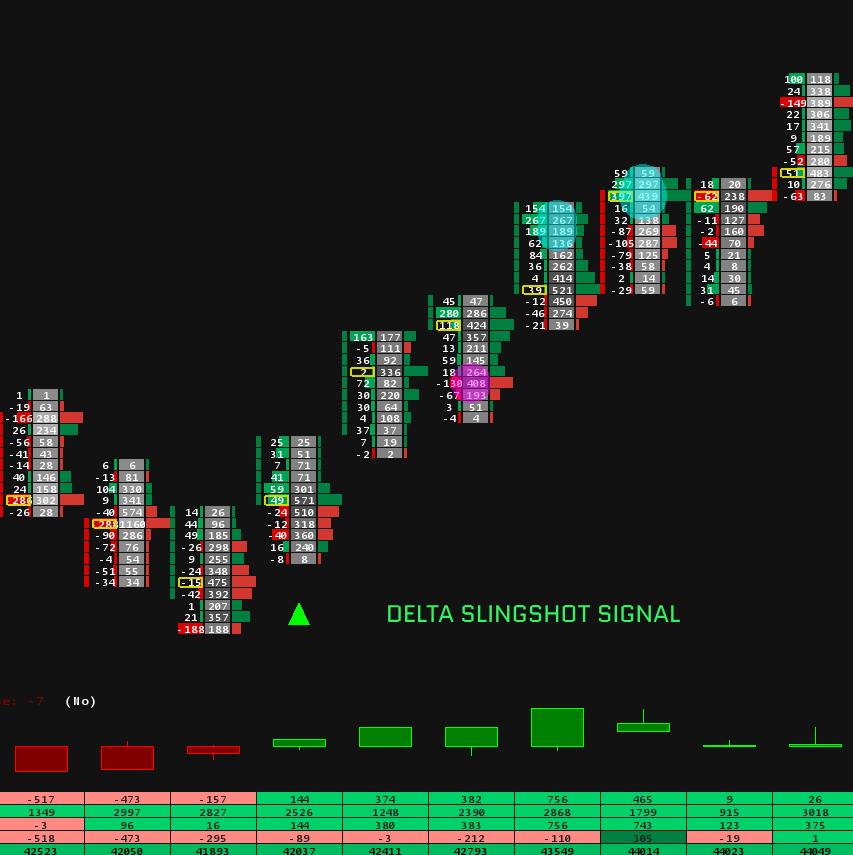
Open Chart, then Chart Settings and look at the Bar Period section. Footprints work on any bar type, but volume based bars align the footprint with activity instead of the clock, which is how most order flow traders run them. The screenshots in this guide run ES at 3000 contracts per bar, a solid starting point for that market. Time based bars of 5 or 15 minutes also work and are easier to relate to a classic chart while learning.

Step 3: add the Numbers Bars study
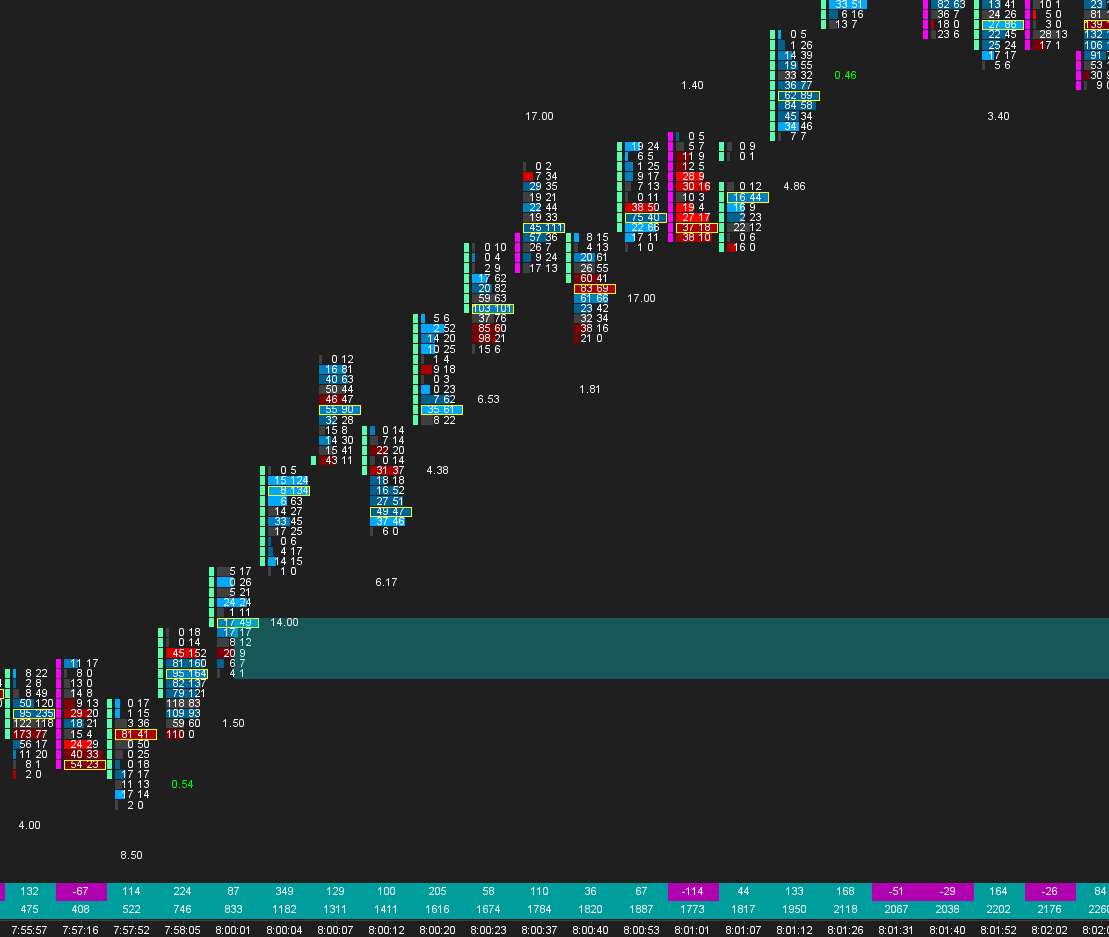
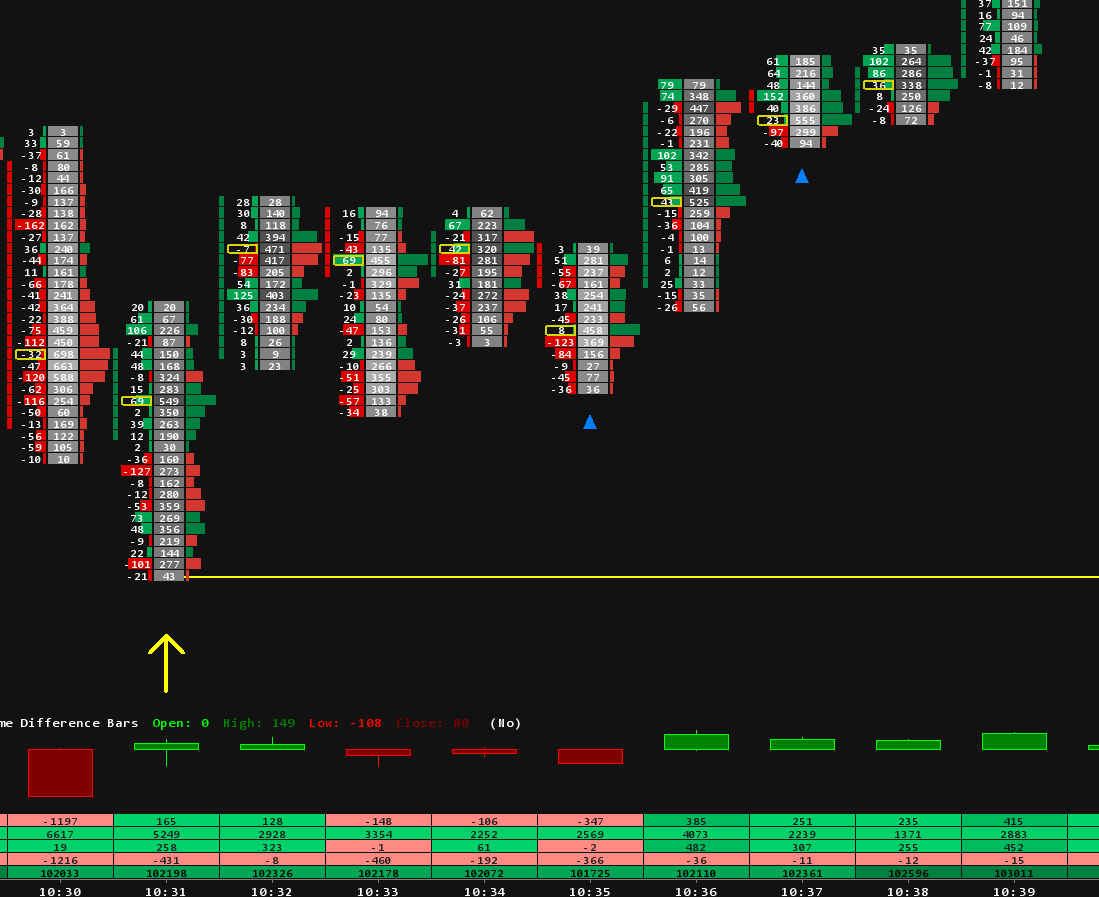
Open Analysis, then Studies, find Numbers Bars in the list of available studies, and add it to the chart. The chart immediately changes character: each bar becomes a column of cells, one row per price, and each cell shows the volume that traded there. Expect it to look cramped at first. Widen the bar spacing with the chart spacing controls until the numbers are readable.

Step 4: the four settings that matter first
The Numbers Bars study settings run to many pages. Four decisions produce a usable footprint, and everything else is refinement:
- What each cell displays. The setting is called Column 1 Numbers Bars Text, and the classic choice is Bid Vol x Ask Vol, the diagonal comparison that shows who was lifting the offer and who was hitting the bid. Delta per cell is the other common choice.
- Imbalance highlighting. Numbers Bars can color a cell when one side dominates its diagonal counterpart by a chosen percentage. A threshold around 300 percent is a common starting point, strict enough to keep the chart quiet.
- Text and cell size. Enable the automatic text sizing options, then adjust until a full session stays readable at your usual zoom.
- Colors. A restrained scheme, neutral cells with imbalances in two clear colors, reads far better in live trading than a rainbow.

Work through these four in the study settings, close the window, and you have a functional footprint.
Step 5: save it as your first template
Use File, then Save Chartbook As and give the file a name you will recognize. A chartbook saves the whole workspace, the chart, the study, every setting, and this file is your template: reopen it any day, change the symbol, and the footprint is ready. Everything we sell works the same way, a chartbook file you open in Sierra Chart, which is why building one yourself, even a basic one, teaches you how the professional ones are put together.

How to read what you built
Three signals carry most of the information. Delta, the difference between buying and selling in a bar, tells you which side was aggressive. Imbalances, the highlighted cells, show where one side overwhelmed the other, and stacked imbalances often mark levels that hold. Unfinished business, a high or low where both bid and ask still traded, suggests the auction may revisit that price. Our guide to order flow sequencing goes deeper into reading these patterns, and the Bookmap vs Sierra Chart comparison covers how footprints relate to heatmap tools.
From a basic footprint to a professional workspace
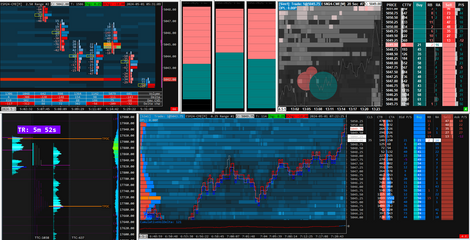
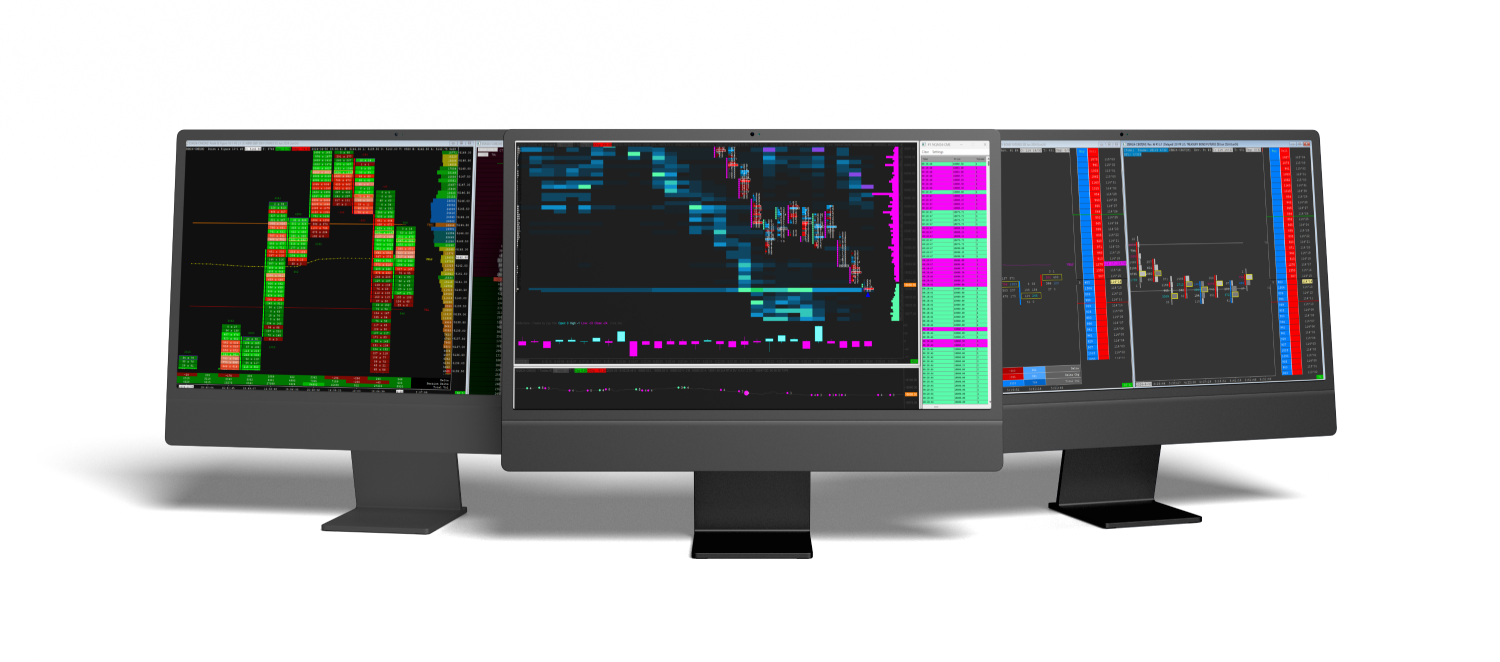
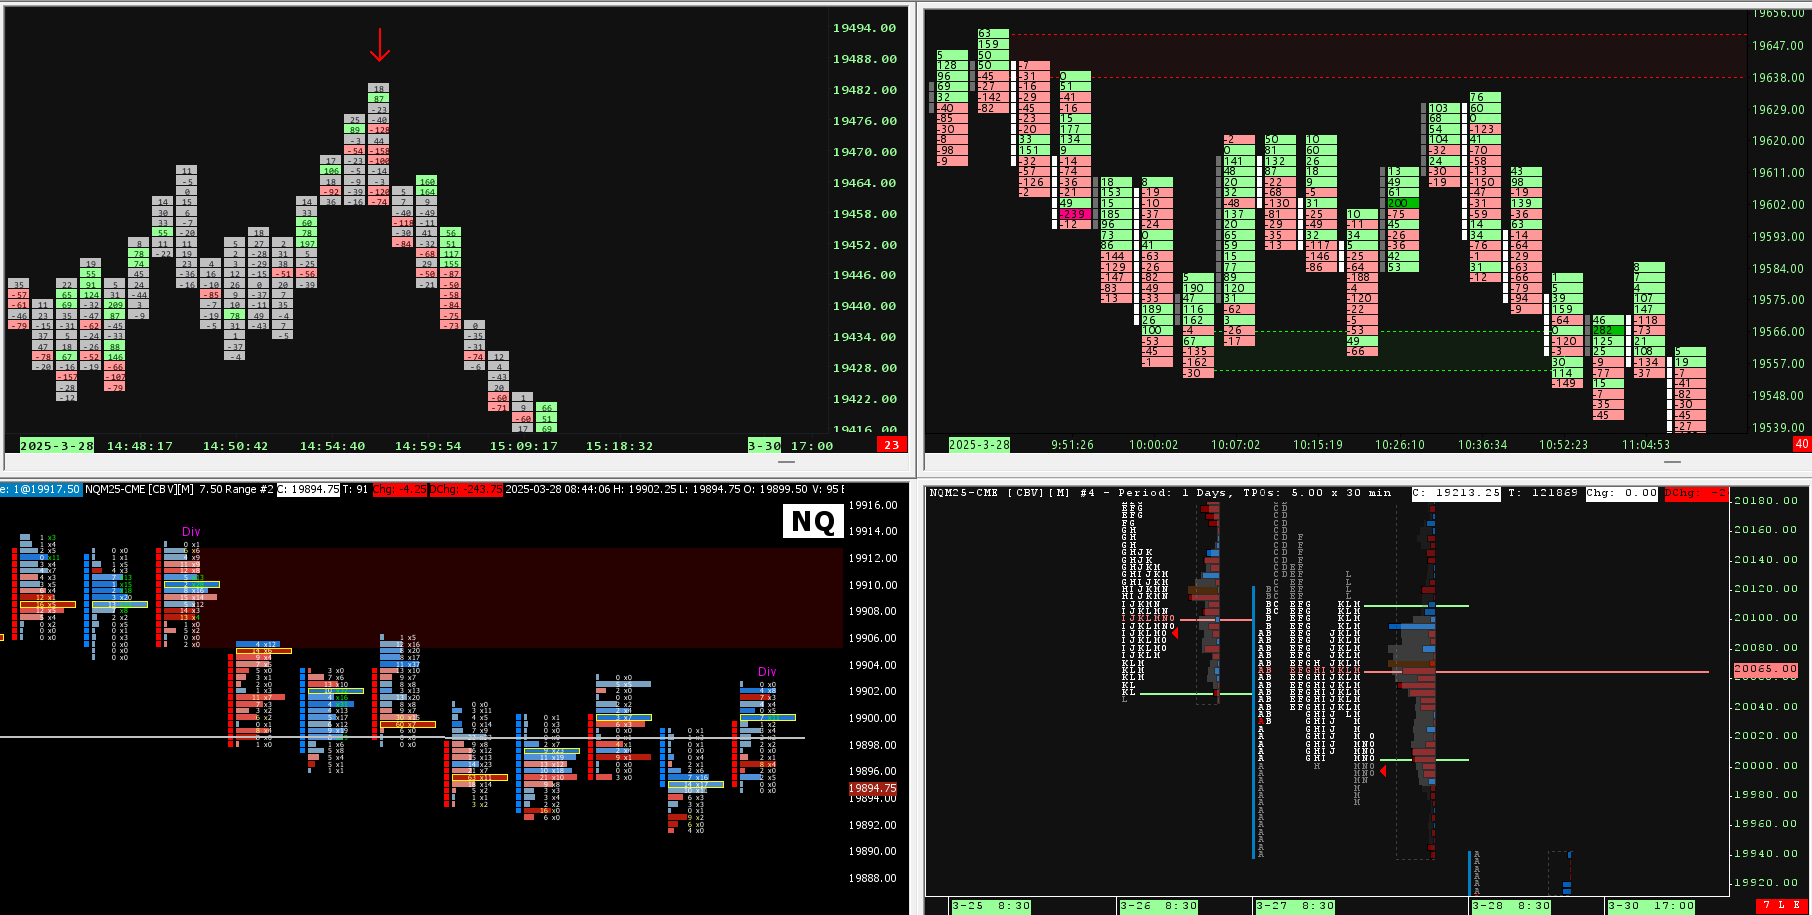
What you built is genuinely usable, and it is also the skeleton of something larger. The difference between this and a professional setup is tuning and context: thresholds calibrated per instrument, volume bar sizes that match how each market actually trades, color scales tested across full sessions, and the footprint sitting next to a volume profile, a DOM and a delta panel in one coordinated workspace. That tuning is what our footprint chart templates deliver, with ready chartbooks like the NQ optimised footprint template and the four panel Treasury footprint workspace. For signal based tools that read the footprint for you, the Sierra Chart indicators collection is the place to look, and the complete Sierra Chart templates catalog covers every chart type in one place.
Quick answers
Why do my cells show one number instead of bid and ask volume?
Your intraday data is not stored at 1 tick. Fix the storage setting from step 1, then delete and re download the symbol's data.
Do footprints need market depth data?
No. Numbers Bars is built from trades and the best bid and ask. Market by order depth only matters for heatmap style tools.
Which Sierra Chart package do I need?
Package 5 at minimum for the study itself. For CME futures data through Denali you need one of the Integrated packages, 10, 11 or 12.
Volume bars or minute bars for footprints?
Both work. Volume bars keep each footprint column statistically comparable, which most order flow traders prefer. Minute bars are easier while learning because they match the charts you already know.