


Before you leave...
Check our Sierra Chart Suite PRO
Sierra Chart Footprint + Signals Bundle
A re-engineered footprint that exposes delta, volume, and dominance in three clean columns, with automated reversal, divergence, and stacked imbalance signals layered on top.
Limited Offer: Save $40 On The Bundle
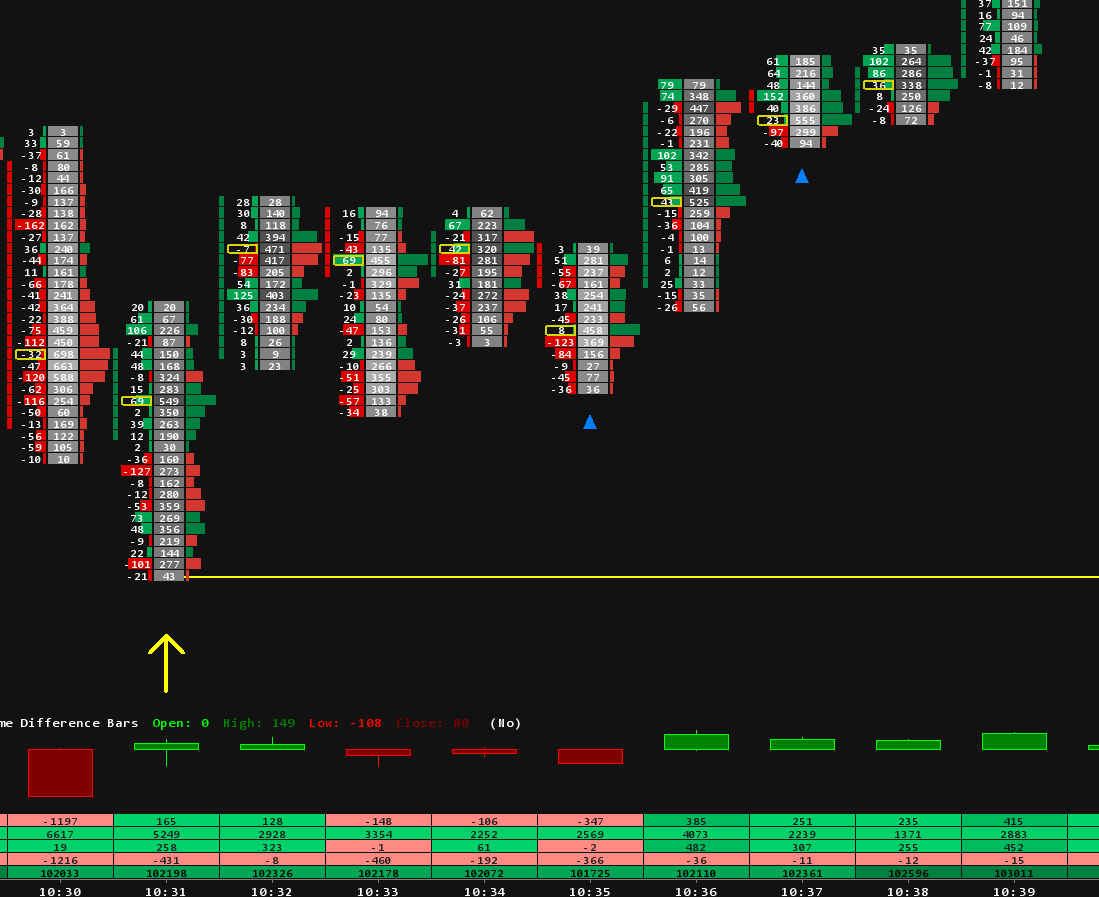
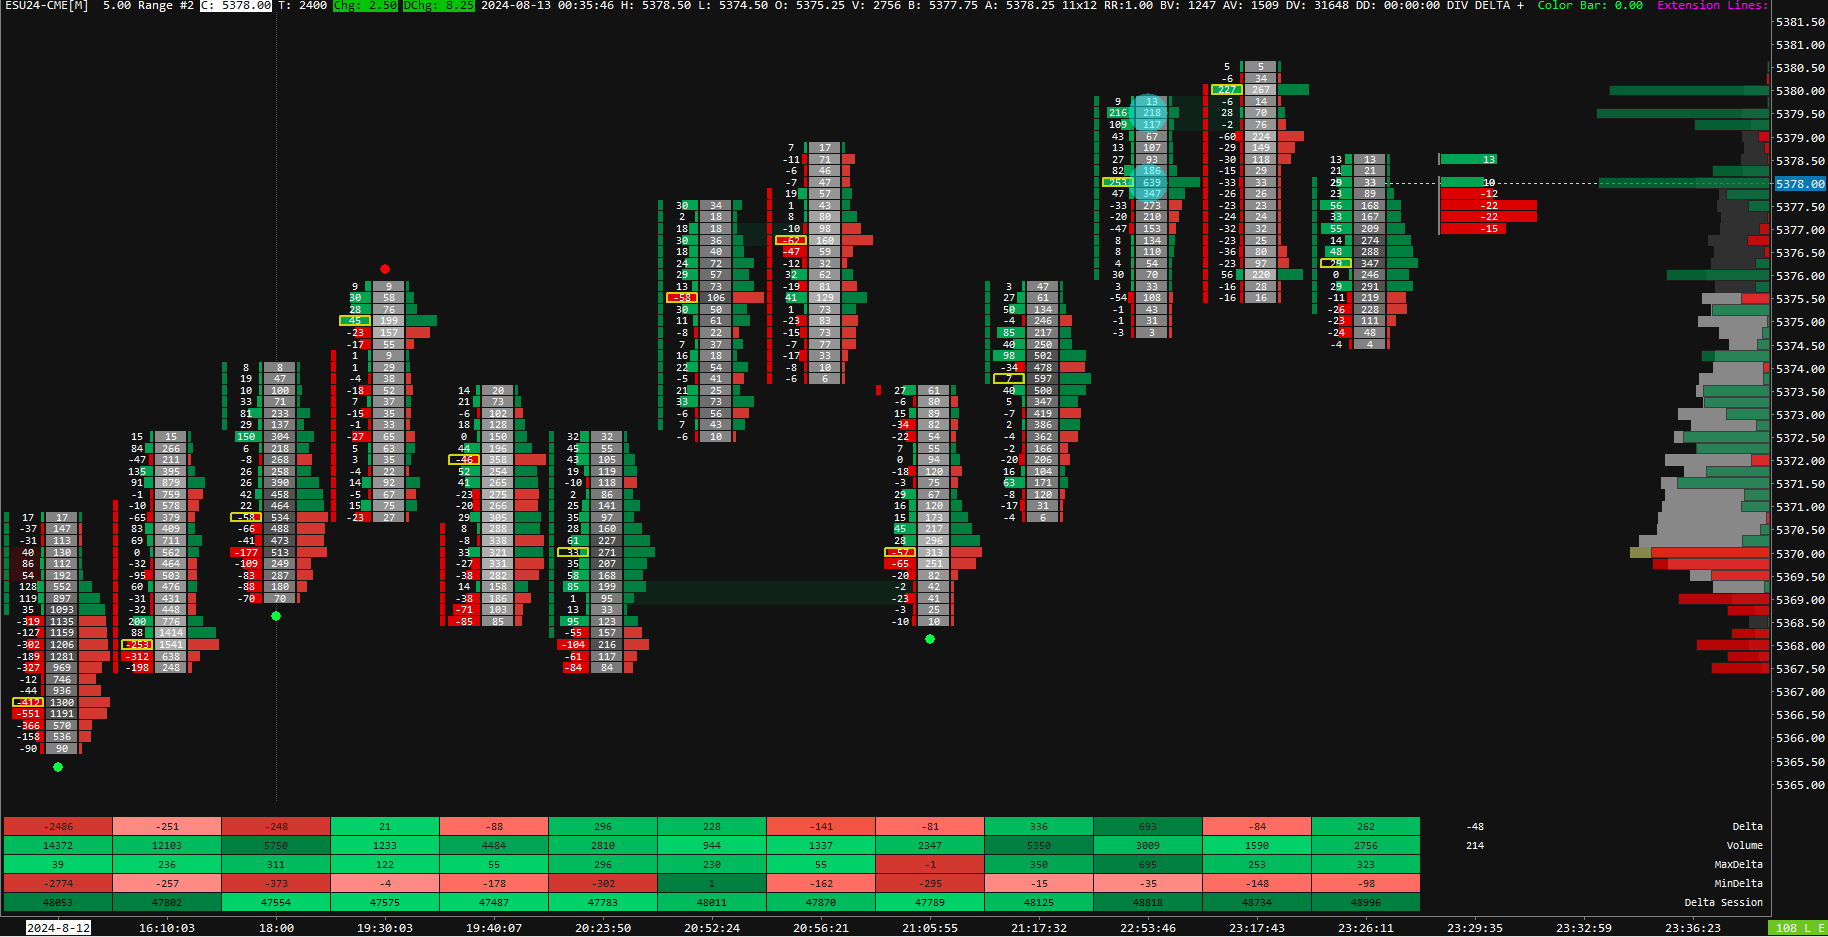
Standard footprints throw every number at you and let you sort it out at speed. By the time you've parsed the bar, the move is over.
This bundle re-engineers the footprint into three readable columns (delta, volume, dominance) and layers three automated signals on top: Slingshot reversals, delta divergence, and stacked imbalance extensions. You read order flow at a glance, not by squinting.

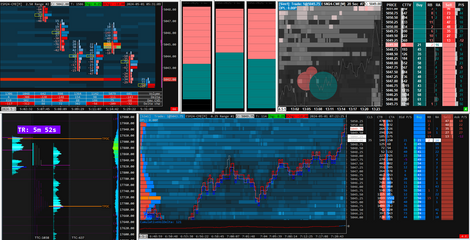
Every footprint shows the same raw data: bid, ask, delta, volume. The difference is how you read it. This template splits the three questions you actually ask at each price level into separate readable columns.
Ask volume minus bid volume. Read it like a thermometer for who's pressing harder at each price.
Total volume at each price level. Find where the auction is spending its capital.
Ask % vs bid % of total volume, an instant visual read on who controls each price.


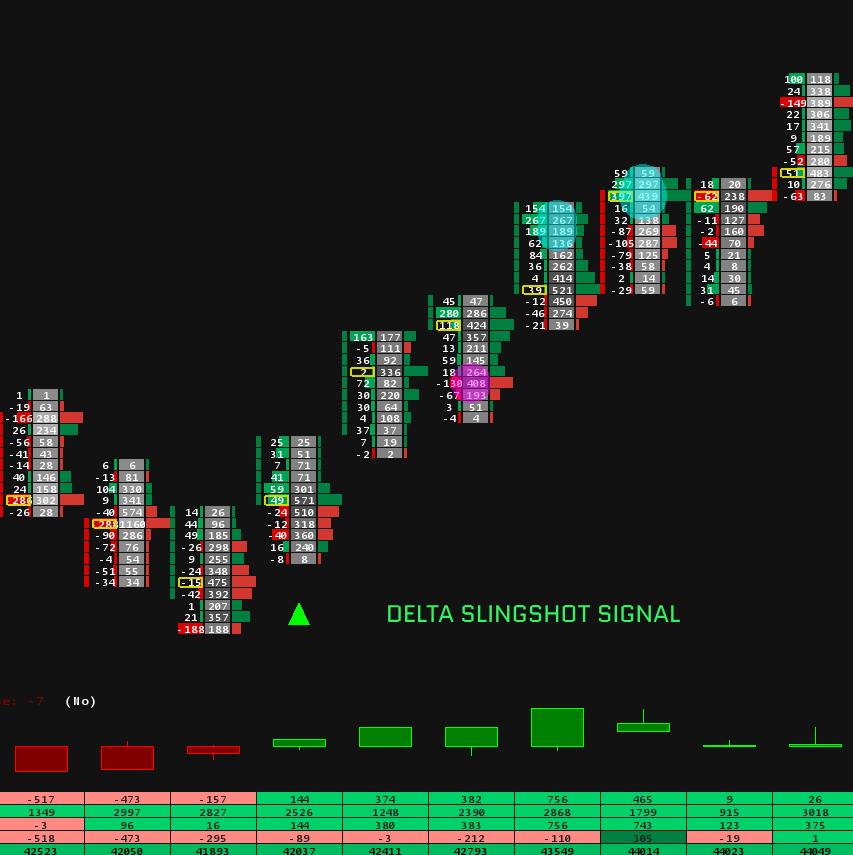
Slingshot fires when delta exhausts against the prevailing move. The moment aggressive buyers (or sellers) stop showing up and the auction starts hunting for the other side, you see it called out automatically. It's the order flow equivalent of momentum exhaustion, flagged on every bar.


When price makes a higher high but delta makes a lower high (or any of the four divergence variants), the move is losing its order flow conviction. Big participants are stepping back even as price keeps printing.


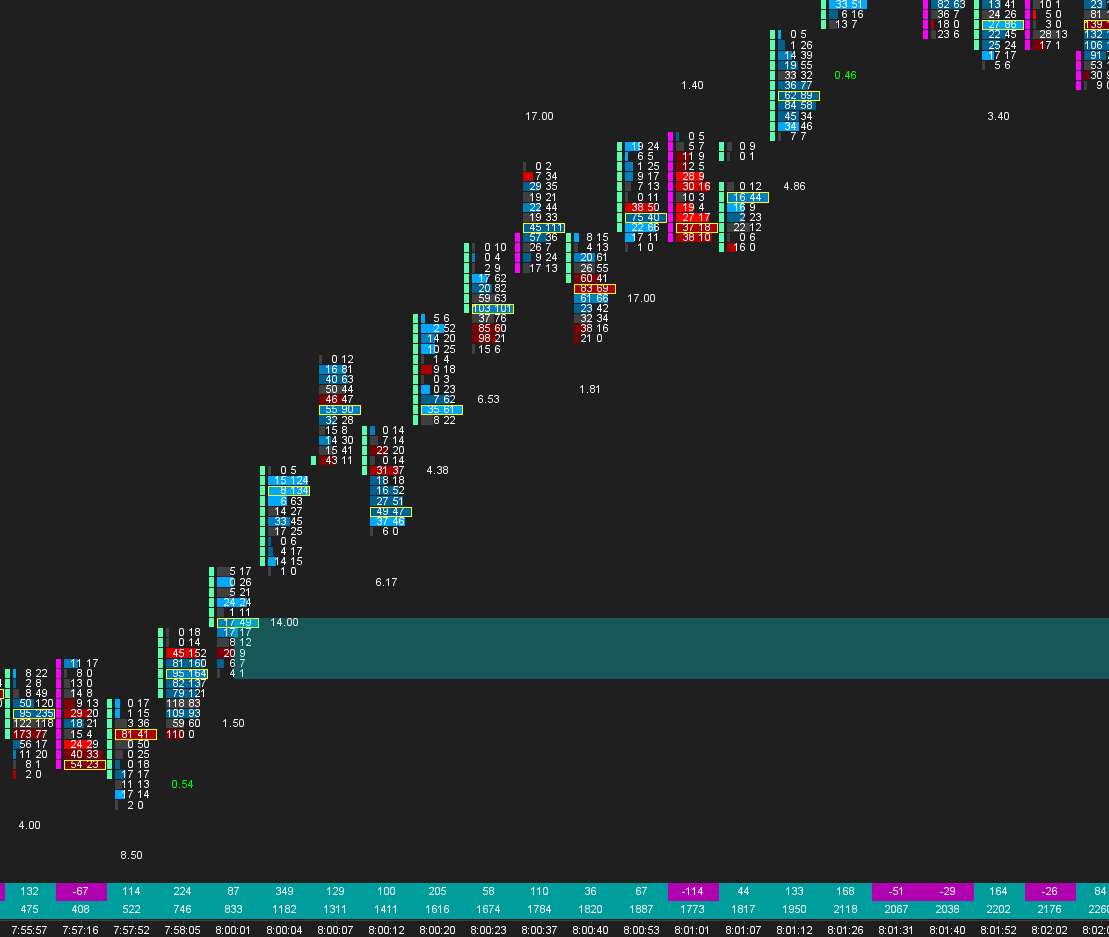
When three or more diagonal imbalances stack vertically at consecutive prices, you've found a zone where one side was unusually aggressive. Aggressive buyers (or sellers) hit the other side hard and repeatedly at those levels. Those zones often defend on future tests, marking real S/R based on actual participant aggression rather than chart geometry.
Most platforms make you spot these manually then draw the lines yourself. This study detects each stack the bar it prints and auto-extends the level forward as a live support or resistance zone until price breaks it.
Ready to read order flow without squinting?

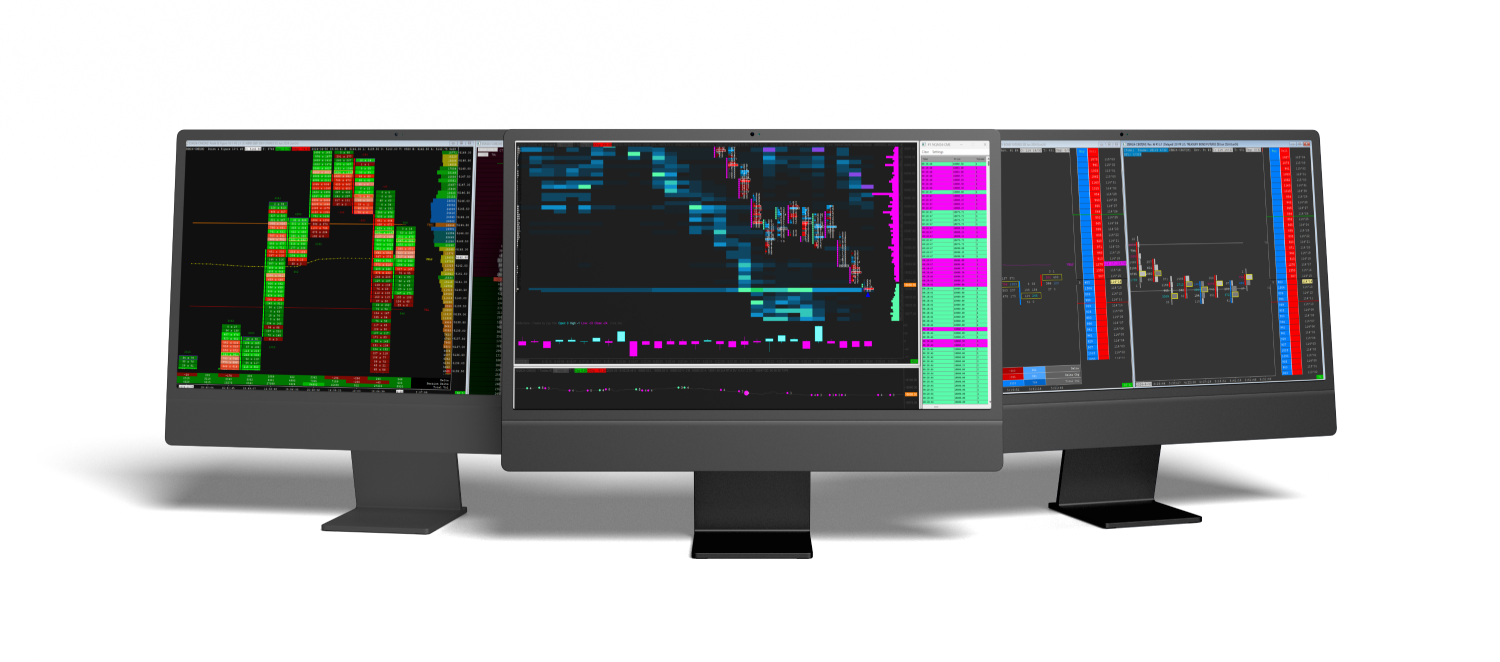
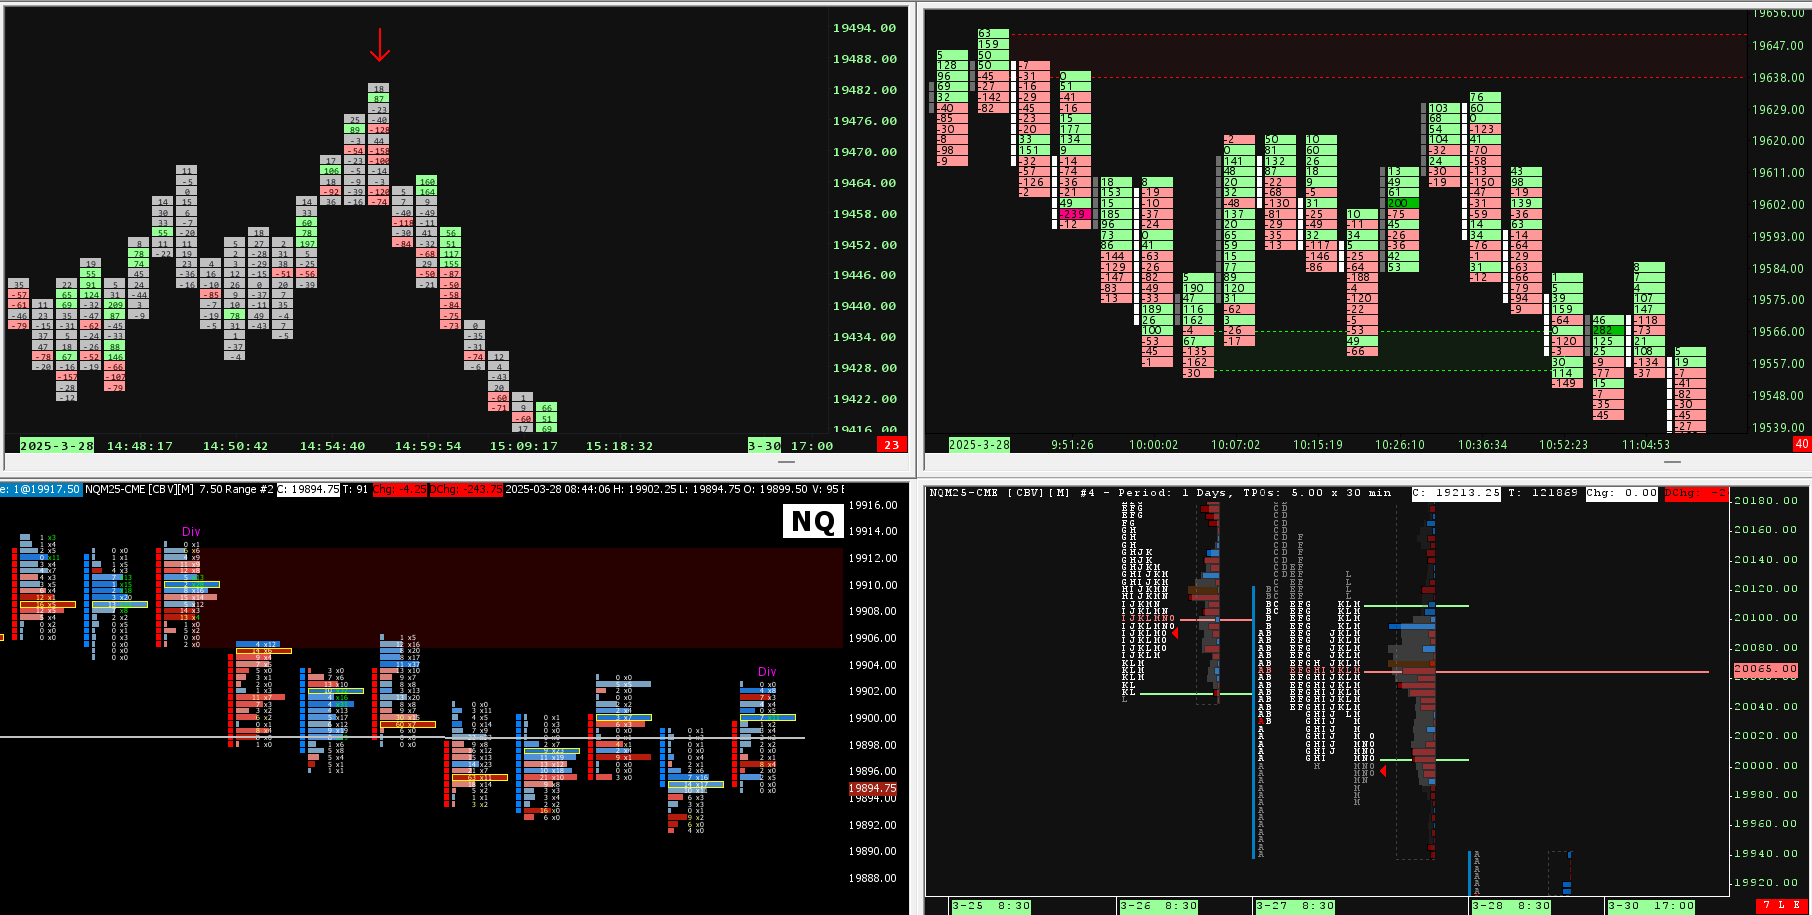
The footprint is your scalpel for intraday execution. This second chart is your wide-angle lens for everything that surrounds it. Pre-built on a 30-minute timeframe with adjustable long-term volume profile, TPO levels, and all the structural references that actually matter for context.
After purchase, email us your Sierra Chart username. We will activate your indicators, then you can load the chartbook (.cht file) directly in Sierra Chart and add the custom studies from Analysis, Studies, Add Custom Study.
Yes. Updates are included and delivered through Sierra Chart so you do not need to manage manual installations.
You need Sierra Chart Service Package 5 or higher to use the indicators properly.
Yes. The bundle is a one-time purchase. You get lifetime access to the template, all signal layers, the bonus long-term analysis chart, and free updates with no recurring subscription.
Yes. The studies are designed for multiple timeframes, from short-term scalping charts to higher timeframe analysis. Settings can be adjusted to match your market and trading style.
The studies work with Denali, CQG, Rithmic, and CFD data feeds. They also run in replay mode and backtest, so you can validate the signals on historical data before going live.
Sierra Chart Indicators & Chartbook
Trusted by 1000+ Traders Worldwide
Thanks for subscribing!
This email has been registered!
| Product | SKU | Description | Collection | Availability | Product Type | Other Details |
|---|