




Delta Divergence: Inside the Bar and Across the Swing

In the absorption lesson, aggressive buyers hit the offer again and again, and price still went nowhere. Put a number on that and you get a divergence: delta says buyers were in charge, price says they were not. Delta divergence is that disagreement, and it shows up at two scales: inside a single bar, and across a whole swing on cumulative delta. This article takes both apart, along with the ways each one misleads.
Delta and cumulative delta in one minute
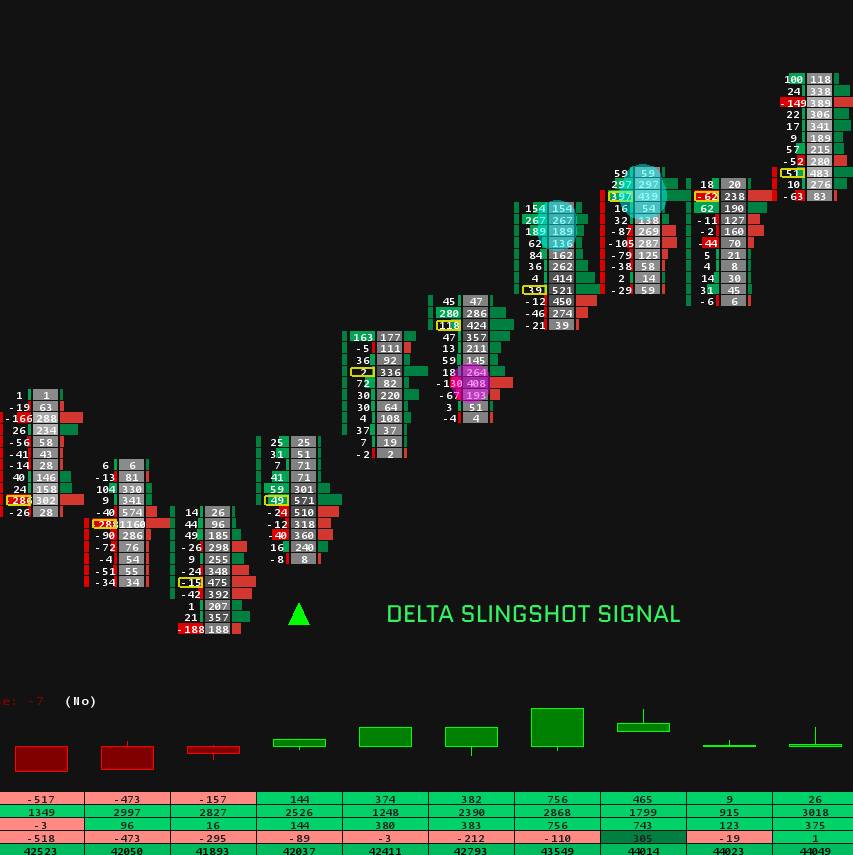
Delta is the volume bought at the ask minus the volume sold at the bid. It measures who was aggressive: positive delta means market buyers took more than market sellers gave, negative delta the reverse. On a footprint chart you see it under each bar, as in every diagram in this series. If you have not built one yet, our footprint setup guide walks through it.
Cumulative delta, usually shortened to CVD, is the running total of delta from a starting point. Each bar adds its delta to the total, so CVD rises while buyers are the more aggressive side and falls while sellers are. Plotted under price, it lets you compare the aggression behind one swing with the aggression behind the next.
Neither number is a prediction. Delta tells you who pushed, not who won. A divergence is what you see when the side that pushed did not get the result it paid for.
Bar divergence: up, then down, on positive delta
The simplest divergence lives inside one bar: a down bar with positive delta, or an up bar with negative delta.

In the diagram, buyers drive price up for three bars. The first two show stacked buy imbalances and strong positive delta. The third makes a new high on a smaller bar. Then bar 4 trades above the high of the push, with 650 contracts bought at the ask at its two highest prices, and delta for the bar ends at plus 470. It still closes a point below its open.
That is absorption measured in one bar. Aggressive buyers did their part, and resting sell orders above the market took everything they sent. The buyers who lifted those offers are now holding longs at the highest prices of the move. Bar 5 shows the response: three stacked sell imbalances, delta minus 760, and a close well below where bar 4 opened. A bar like this on a spike above an old high is often the first sign of a liquidity grab.
The mirror version is an up bar with negative delta at a low: sellers hit the bid hard, and passive buyers absorbed it.
On its own, a bar divergence is common. Plenty of bars close against their delta in the middle of a quiet range, and they mean very little. It earns attention in the same places absorption does: after a push into a new high or low, at a level the market already cares about, and when the next bar confirms it.
CVD divergence: comparing one swing with the next
Bar divergence looks at one bar. CVD divergence zooms out and compares the aggression behind one swing with the aggression behind the next. There are two kinds, and they point in opposite directions.

Regular divergence: a possible turn
Price makes a higher high, but CVD makes a lower high. The second push up reached a better price on less aggressive buying than the first. Either buyers are running out of conviction, or passive sellers are absorbing them on the way up. Both are reasons to stop assuming the move will simply carry on.
The bearish version is on the left of the diagram. The bullish version is its mirror: a lower low in price with a higher low in CVD, sellers pushing price lower with less and less aggression.
Hidden divergence: the trend continues
Hidden divergence happens on the pullbacks. In an uptrend, price makes a higher low while CVD makes a lower low. Sellers hit the market harder on the second pullback than on the first, and still could not push price as low. Someone absorbed that selling, and the read favours the trend carrying on. It is the absorption lesson again, read from a delta line instead of a footprint.
In a downtrend the hidden version is a lower high in price with a higher high in CVD: buyers pushed harder on the bounce and still fell short of the last high. That is the pullback into weakness, seen on cumulative delta.
When divergence fails
Divergence is one of the most popular order flow ideas, and one of the easiest to misuse. Two traps catch most people.

In a strong trend. CVD can diverge again and again while price keeps climbing. In the left panel, each new high in price comes with a lower high in CVD, three divergences in a row, and each one looked like a top. Price can rise on passive buying: buy limit orders that keep stepping up under the market, while aggressive traders keep selling into them. In that case falling CVD is not weakness in the trend. It is sellers losing. A divergence against a strong trend needs the trend to actually break before it means anything.
The reset trap. CVD is a running total, so it depends on where the count starts. Many traders reset it at the start of each trading day. In the right panel, today's high is above yesterday's while CVD seems to make a lower high. It did not: the count restarted at zero at the open. Only compare swings that sit inside the same count, which means the same session if you reset daily.
A few more ways it misleads:
- Divergence in a range. Without a trend, swings are small and CVD wanders. Divergences appear everywhere and mean little.
- News and the open. A data release or the first minutes of a session can swing delta in ways that have little to do with the move you are reading.
- Quiet markets. In thin periods, a handful of large trades can move CVD more than the swing deserves.
What to wait for
A divergence tells you the side in control is getting less for its effort. It does not tell you when that side gives up. The rule from every lesson in this series applies: judge what happens next.
- Location. A divergence at a level that matters, such as a prior high or low or the edge of a range, deserves more attention than one in open space.
- Both scales agreeing. A regular CVD divergence at a high, with a bar divergence on the final push, is two readings telling the same story.
- Structure. After a bearish divergence, a lower high and then a break of the last higher low turn a warning into a change, the turn described in the anatomy of a reversal, seen from the top.
- Sellers on the footprint. Sell imbalances and negative delta on the move down, as in bar 5 of the first diagram.
The read is wrong when price makes a new high and CVD makes a new high with it. The buyers found their conviction again, and the divergence is gone.
Common mistakes with divergence
- Treating it as an entry. Divergence is a warning about effort, not a signal to act on by itself.
- Fighting a strong trend with it. In a trend, divergences can stack up for hours. Wait for structure to break.
- Comparing across a reset. A swing before the open and a swing after it are on different counts.
- Mixing up regular and hidden. Regular divergence compares the highs of an uptrend and warns of a turn. Hidden divergence compares the lows and favours the trend. Read the wrong one and you reach the opposite conclusion.
- Switching delta types. Delta built from volume, from trade count or from up and down ticks can disagree. Pick one and stay with it.
See it live
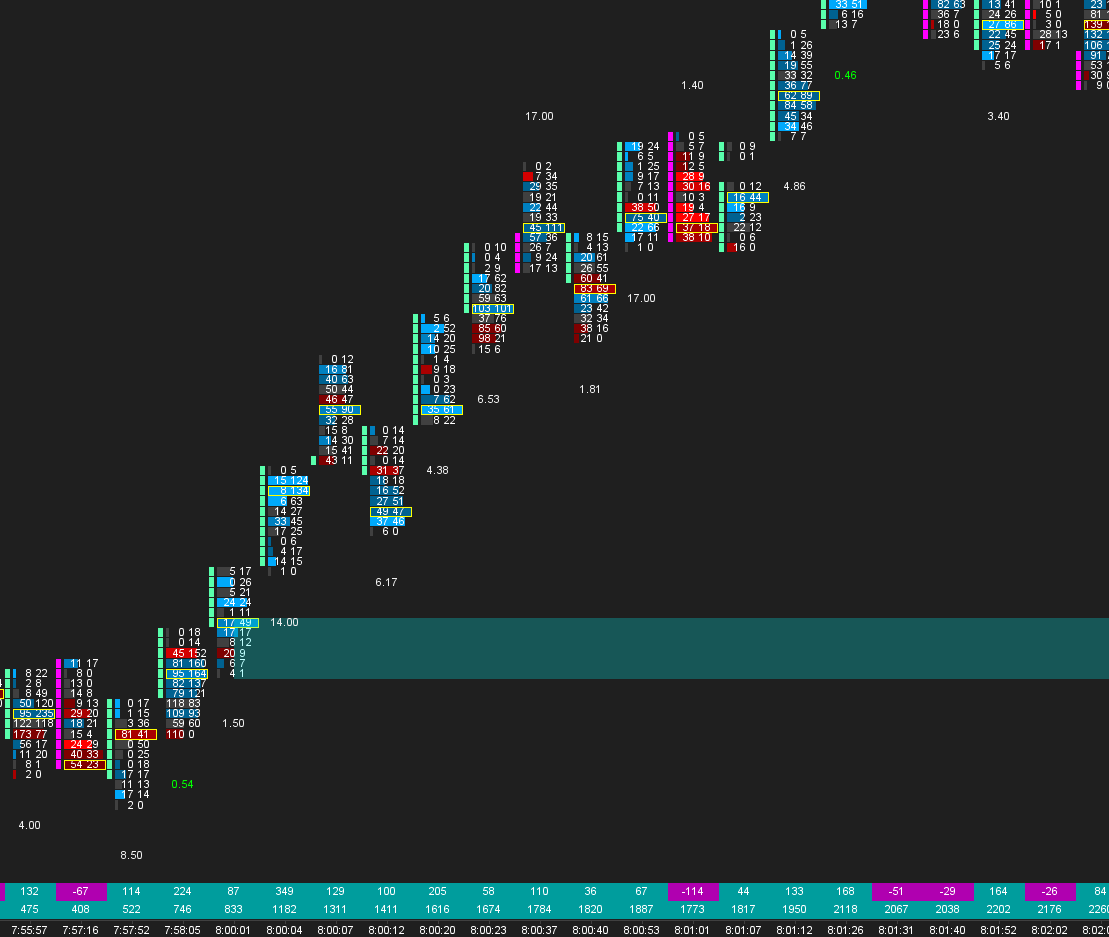
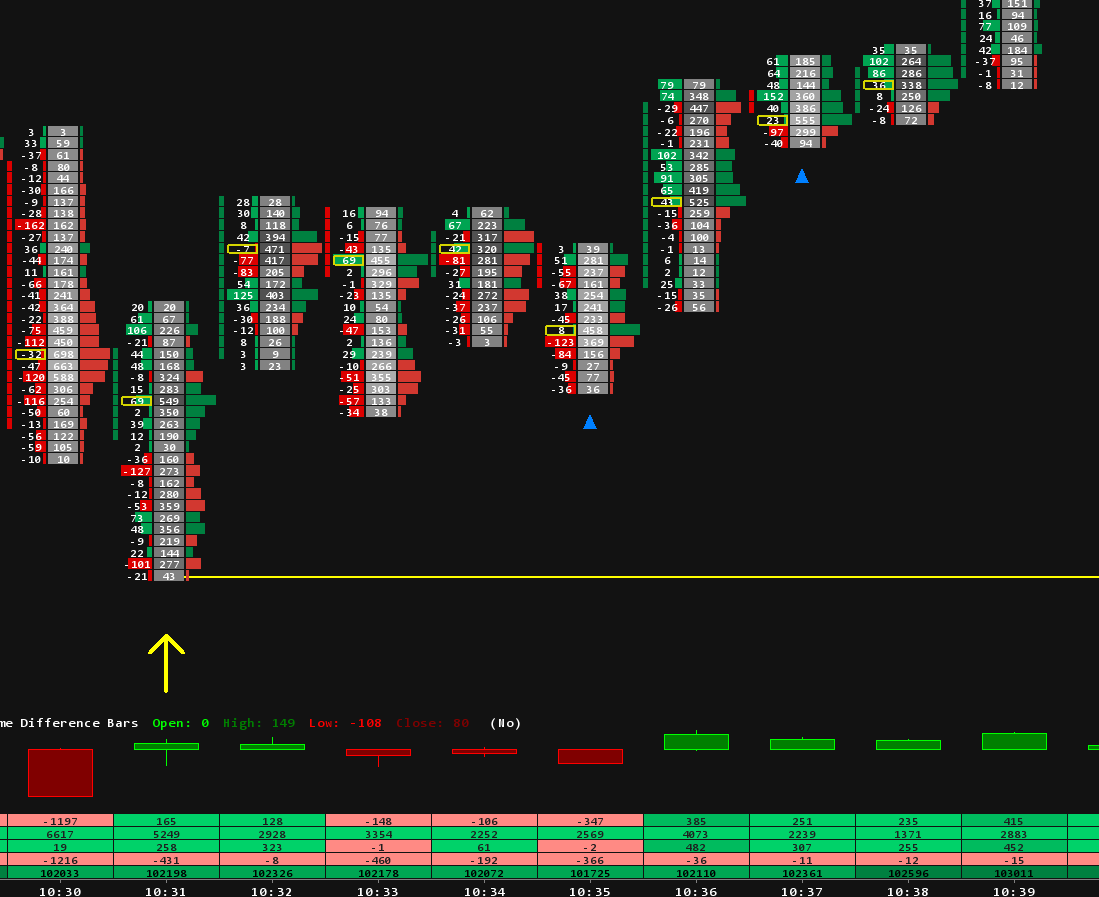
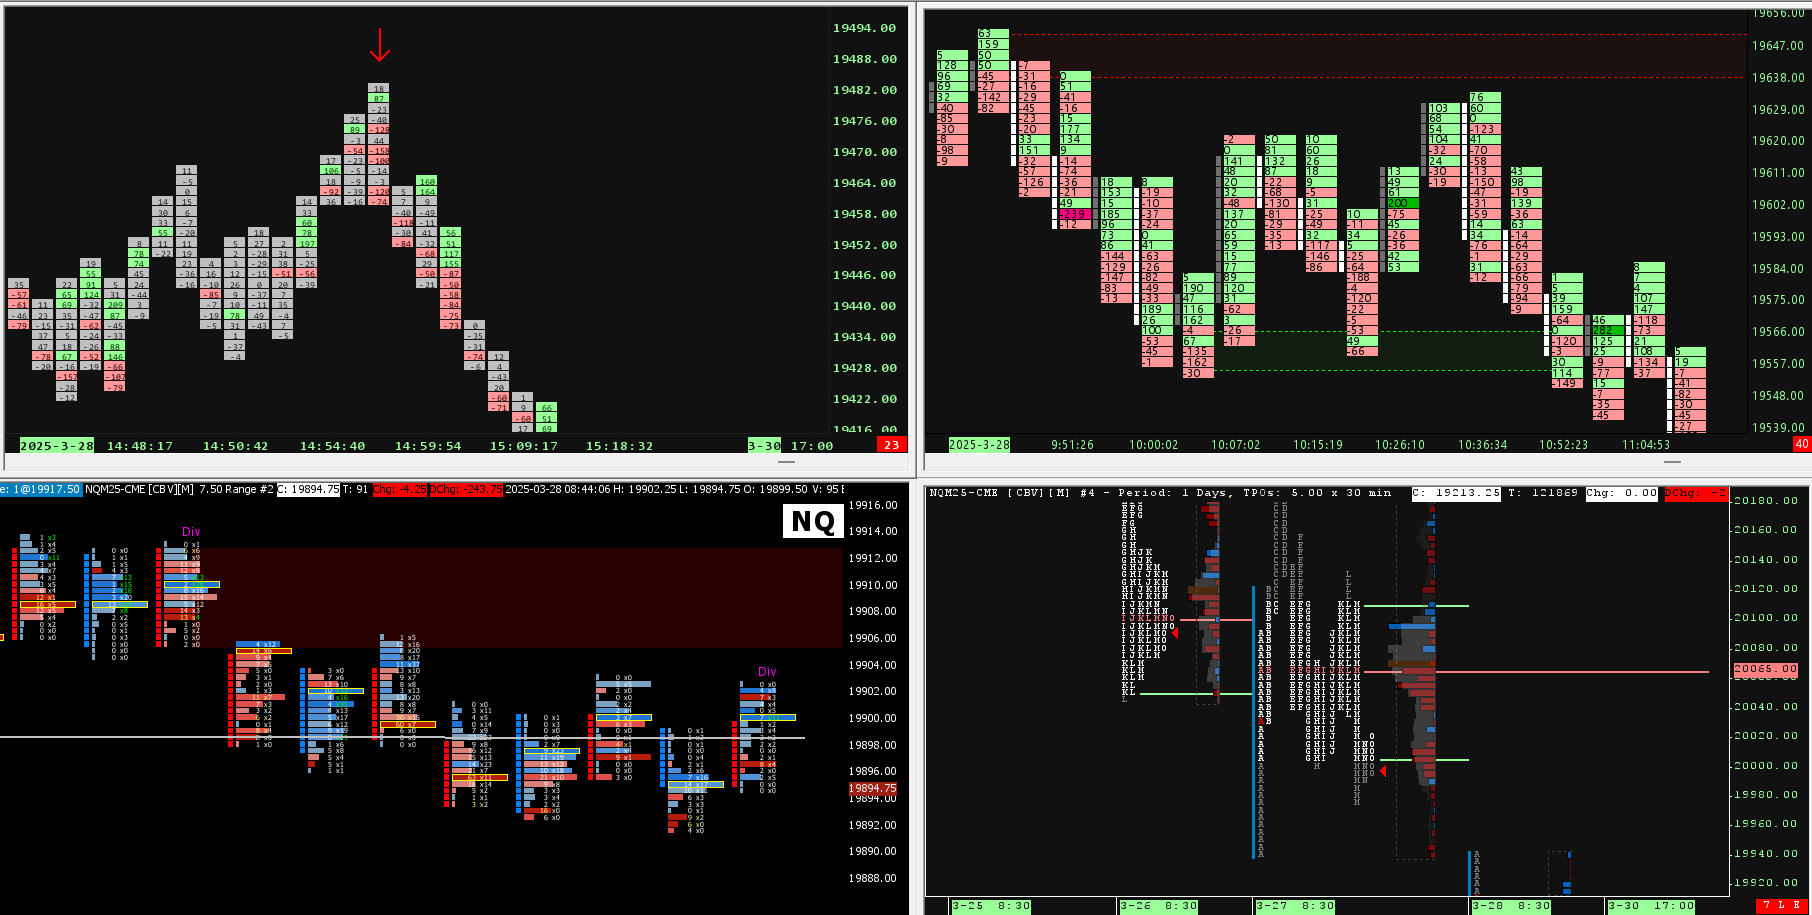
Two short examples on NQ. The first is the bar scale: absorption and delta on a footprint. The second is the swing scale: a divergence on cumulative delta before the move.
Seeing it in Sierra Chart
Sierra Chart has CVD built in. The study is called Cumulative Delta Bars, and it comes in three versions: Volume, Trades and Up Down Tick Volume. It draws CVD as candlesticks in its own region under price. Two settings matter for everything in this article:
- Reset at Start of Trading Day. Set to Yes, CVD restarts at zero each day, and you only compare swings inside one session. Set to No, it runs across every day loaded in the chart, and its values shift whenever the chart reloads from a different start date.
- Tick by tick data. Sierra Chart's documentation asks for intraday data stored at 2 seconds or less, and tick by tick for the most accurate result. It is the same setting as step 1 of the footprint setup guide.
For delta per bar, the Bar Delta Below Bar study prints each bar's delta under it, or you can read it straight from a footprint layout like our footprint chart templates.
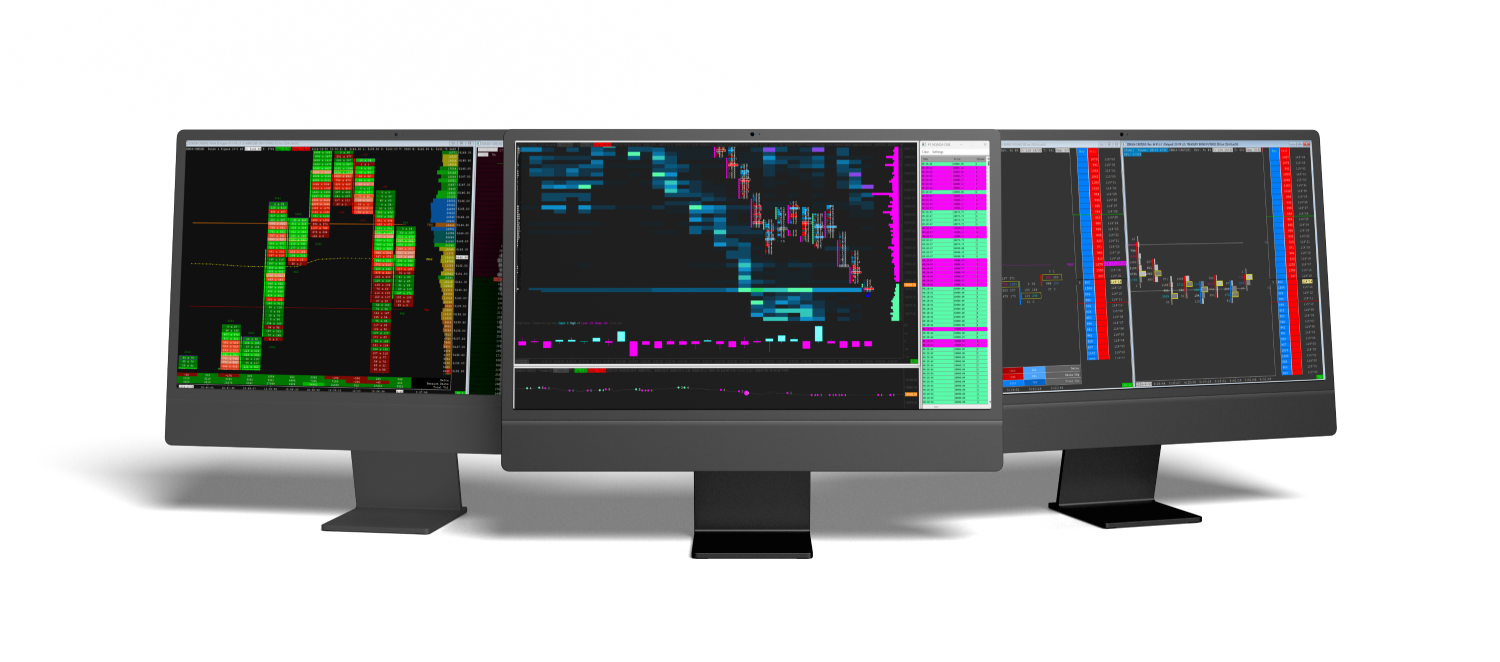
Spotting divergences live, at both scales, is the hard part, and it is what two of our studies are built for:
- The Orderflow Suite includes a Delta Divergence study that marks bars where price and delta disagree: an up bar on negative delta, or a down bar on positive delta.
- Our CVD Divergence Indicator works at the swing scale. It reads your CVD study, draws divergence lines on both price and CVD, and detects hidden divergences as well as regular ones, on any bar type.
The rest of our studies are in the Sierra Chart indicators collection.
In the next lesson we step back from the footprint and look at market profile: the reference levels that show where the market has already done business.
Trading futures involves substantial risk of loss and is not suitable for every investor. This article is education, not trading advice.