




What Is a Liquidity Grab? Reading the Spike Above an Old High

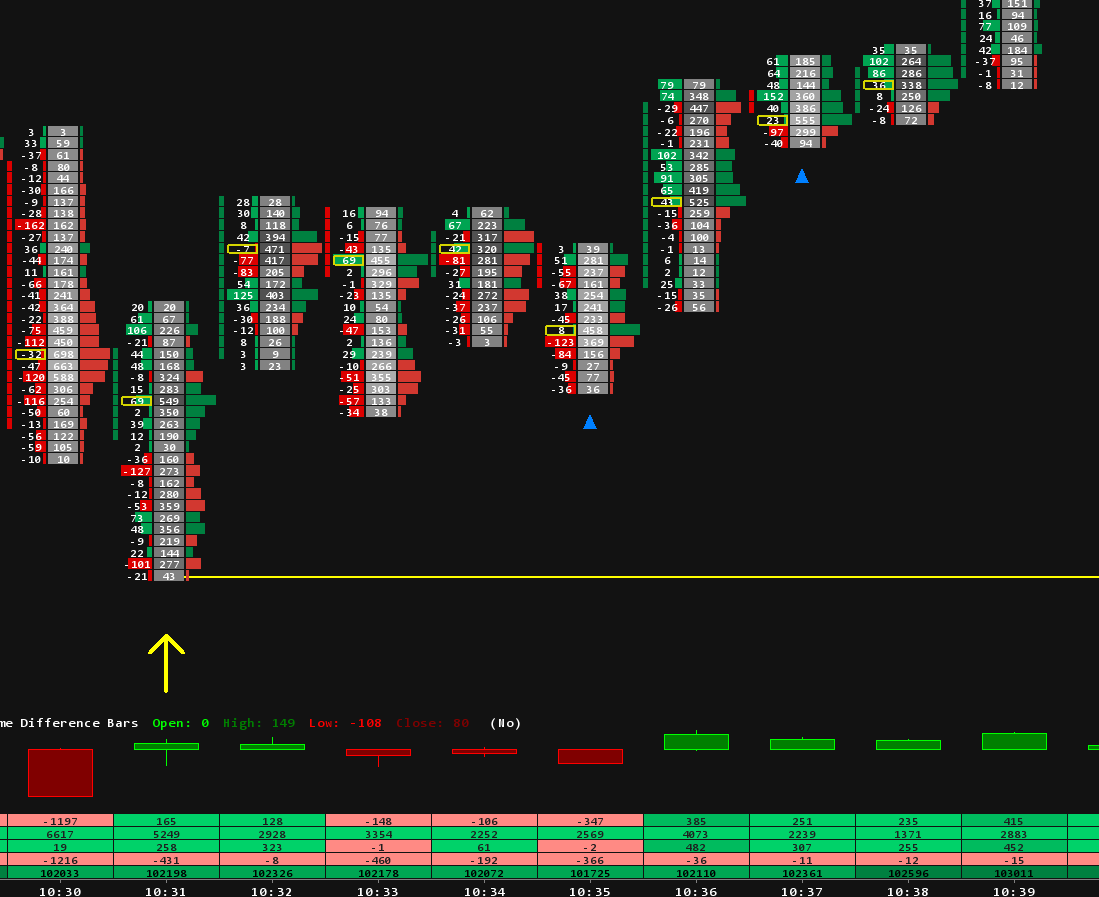
In the last article we read a turn at a low: sellers broke an old low, ran into absorption and got trapped. This article looks at the same idea from the other side, inside a downtrend. A rally climbs back to an old high, spikes just above it, and fails. That spike has a name, the liquidity grab, and once you know what is sitting above an old high, it stops looking like a random wick.
What is liquidity in trading?
Liquidity is simply orders waiting to be filled. Every trade needs two sides: a buyer who pays the ask needs someone selling there, and a seller who hits the bid needs someone buying there. A small trader always finds that other side. A large trader often does not, which is why, as we saw in the article on accumulation and distribution, big positions are built and unwound slowly, wherever orders are available.
Orders are not spread evenly across the chart. They cluster at prices that everyone can see:
- Above old highs. Traders who are short place their protective buy stops just above a swing high. Breakout traders place buy orders there to catch the move up.
- Below old lows. The mirror image: sell stops from longs, and breakout sell orders.
- Equal highs and lows. Two or three tops at the same price look like strong resistance, so even more stops collect just beyond them.
- Session highs and lows. The previous day's high and low, or the overnight range, are levels every trader watches. Our guide to highlighting sessions in Sierra Chart shows how to mark them.
Why does price get pulled to an old high?
Think about a trader who wants to sell a large position in a downtrend. They need buyers, a lot of them, at one price. Above an old high sits exactly that: a pile of buy stops and breakout buy orders that all turn into market buy orders the moment price touches them.
So when a rally reaches the old high and pokes above it, those orders fire at once. Shorts are stopped out, breakout traders pay up, and for a few moments there is a burst of aggressive buying. A large seller can fill a big order into that burst without pushing price against themselves. When the burst is over and nobody is left to buy, price drops back below the level. That is the grab: a move that exists to find orders, not to start a new trend.
Nobody has to plan this in a back room. It is enough that the orders are there, that everyone can see where they are, and that someone large is happy to take the other side of them.
The liquidity grab, step by step
Here is the pattern in a downtrend, where it matters most. The rally up to the old high is a pullback inside the trend, and the grab is where that pullback runs out.

- A downtrend. Lower highs and lower lows set the context. Sellers are in control on the bigger picture.
- An obvious high. A previous swing high that everyone can see, with stops and breakout orders resting above it.
- The grab. A rally reaches the high and spikes through it, fast. Volume and buying jump as the orders above the level are filled.
- Back below the level. Price cannot hold above the high and falls back under it, often within a bar or two. Everyone who bought the breakout is now trapped above the market.
- The trend resumes. With the buy orders used up, sellers take over again. The next obvious pool of orders is the previous low, and that is often where price heads next.
Notice that even the spike is still a lower high compared with the start of the move. The grab did not change the trend; it fed it.
Grab or real breakout? The first bar looks the same
This is the hard part. Not every move above an old high is a grab. Sometimes the breakout is real and price keeps going, and on the bar that breaks the level, the two can look almost identical. The diagram below puts a grab on the left and a real breakout on the right, at the same level, 6,032.00.
If footprint charts are new to you: each cell shows the contracts sold at the bid on the left and bought at the ask on the right. Bold numbers are imbalances, where one side traded at least three times the other on the diagonal. Delta is the buying at the ask minus the selling at the bid for the whole bar. Our footprint setup guide shows how to build one in Sierra Chart.

Compare the first bar on each side. Both break above 6,032.00 on heavy buying. Both have three stacked buy imbalances. Delta is plus 1,230 on the grab and plus 1,060 on the breakout. Judged on that bar alone, you would call them the same thing. The difference shows up in the next two bars.
The grab, bar by bar
The spike. Price runs to 6,033.50, and the top of the bar is all aggressive buying: 410, 520 and 480 contracts bought at the ask at the three highest prices. Those are the stops and breakout orders being filled. But the bar closes at 6,031.50, back below the old high. All that buying could not keep price above the level.
The retest. Price comes back up to 6,032.50 and stalls. At the high of the bar only 35 contracts were bought at the ask, against 410 at the top of the spike. The buyers who were so eager a bar ago are gone, and delta turns negative.
Sellers step in. Three stacked sell imbalances, delta minus 705, and a close at the low of the bar, 2.5 points under the old high. The breakout has failed. The traders who bought above 6,032.00 are now holding a loss, and every one of them who gives up has to sell, which adds fuel to the move down.
The real breakout, bar by bar
The break. The same heavy buying and the same stacked imbalances, but this bar closes at 6,033.00, near its high and above the level. Buyers did not just push through the old high, they stayed there.
The pullback. Price comes back to test the level and holds at 6,032.00. Only 385 contracts trade, the lightest bar on the chart, and delta is flat. Sellers had their chance to push price back under the level and did not take it. The old high is now acting as support.
Acceptance. Buyers return above the level with two buy imbalances, delta plus 645, and a new high for the move at 6,034.00. Price is trading, and holding, above the old high. That is what acceptance looks like.
Four questions that separate a grab from a breakout
- Where does the bar close? Back below the level points to a grab. Near the high and above the level points to a breakout.
- What happens on the retest? A grab retests the level and finds no buyers. A breakout pulls back to the level and holds it on light selling.
- Does the aggressive buying come back? After a grab, buying at the ask dries up and sellers take over. After a breakout, buyers return above the level.
- Which way is the trend? In a downtrend, a spike above a swing high has the trend against it. In an uptrend, breaking old highs is simply what the trend does.
None of these is a signal on its own. Together they answer one question: did the market accept the new prices above the level, or reject them?
Wait for the failure, not the spike
The most common mistake with liquidity grabs is selling into the spike itself because it is probably a grab. At that moment nobody knows, and a real breakout can run a long way. The information arrives after the spike: the close back below the level, the weak retest, the sellers stepping in. Waiting costs a little price and buys a lot of evidence.
The structure also tells you where the idea is wrong. If price goes back above the high of the spike and holds there, it was not a grab, it was the first leg of a breakout. And it points to where the next pool of orders sits: the previous low, with its own stops underneath.
Where this read goes wrong
- The level breaks for real. Every grab looks like a breakout for a moment, and some breakouts look like grabs at first. If price climbs back above the spike and stays there, accept it and move on.
- Repeated tests. Each test of a level uses up some of the orders resting against it. A level that gets hit again and again tends to weaken, and a later push through can be the one that sticks.
- News. Around data releases, spikes run through several levels at once and footprints get noisy. The pattern needs a market that is trading normally.
- The wrong timeframe. A grab on a 2 minute chart can sit inside a breakout on the 30 minute chart. Know which picture you are trading.
Seeing it in Sierra Chart
A liquidity grab is easiest to read with three things on screen: the levels, the footprint, and delta. Mark old swing highs and lows with horizontal lines, add the previous session's high and low, and run Numbers Bars with Bid Vol x Ask Vol and imbalance highlighting. Our footprint chart templates come with that kind of layout already built.
Spotting trapped traders and absorption live is the hard part. Our Absorption Pack marks them on the chart with Trapped Traders, Absorption Zones, the Absorption Bar and Hammer with Absorption. The Orderflow Suite adds delta studies such as Delta Flips and Delta Divergence. The rest of our studies are in the Sierra Chart indicators collection.
In the next article we stay in the downtrend and look at the quieter version of this idea: a pullback that rises on weak buying, and how to see the weakness before the trend resumes.
Trading futures involves substantial risk of loss and is not suitable for every investor. This article is education, not trading advice.