




Stacked Imbalances: When One Side Takes Over Several Prices

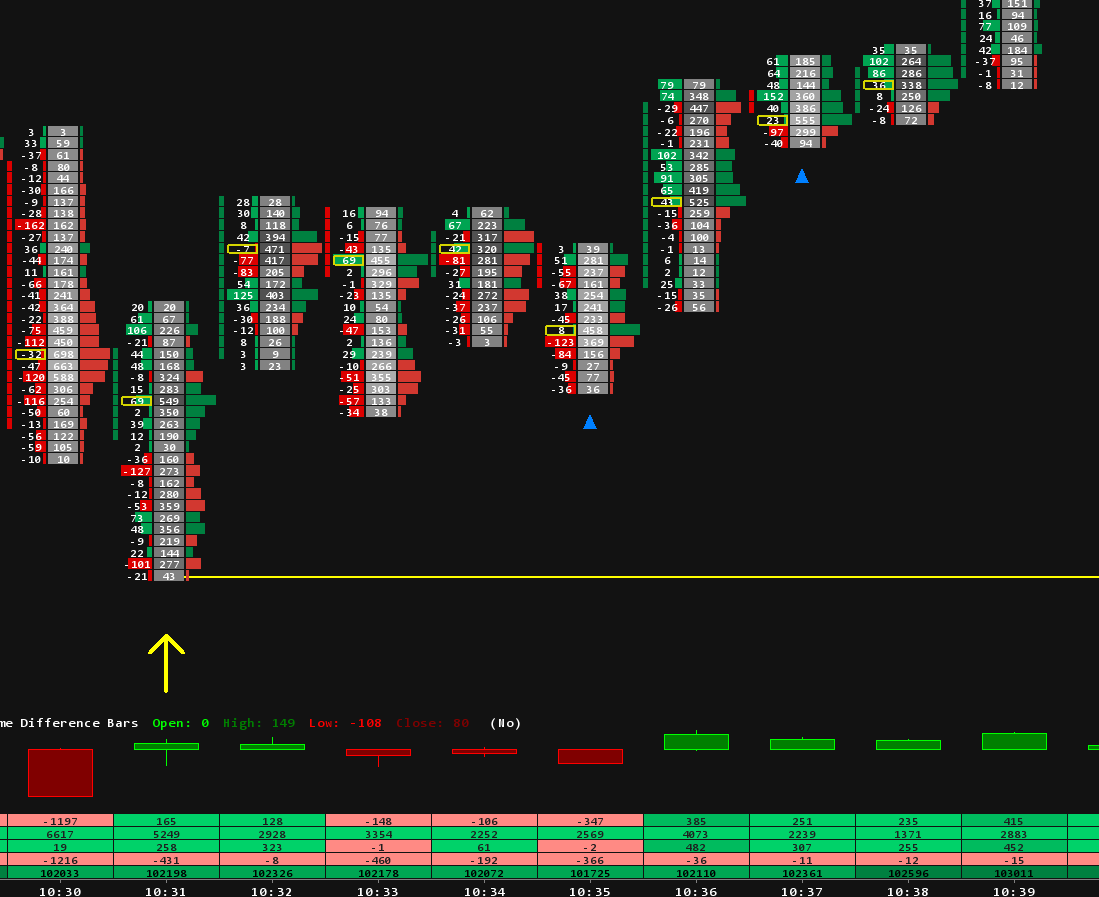
Almost every footprint diagram in this series has had bold numbers in it. In the pullback into weakness, the drop that set up the trade had six bold sell numbers in a row. In the delta divergence lesson, the bar after the divergence had three. Those bold numbers are imbalances, and when several sit on top of each other they are called a stacked imbalance. This article explains how an imbalance is measured, why a stack of them matters, what the price where it happened tends to do later, and when a stack means less than it looks.
What is an imbalance?
An imbalance is a price where one side of the market traded far more than the other. The usual threshold is three to one: at least three times as much volume on one side as on the other. The part that confuses most traders is which two numbers get compared.

A footprint cell shows the volume sold at the bid on the left and the volume bought at the ask on the right. But those two numbers on the same row did not happen at the same moment. When the market is 6,052.50 bid and 6,053.00 offered, sellers hit 6,052.50 and buyers lift 6,053.00. The two sides of that quote sit on different rows, one tick apart. So an imbalance compares the ask at one price with the bid one tick below it: on the diagonal.
In the diagram, 310 contracts were bought at the ask at 6,053.00 against 90 sold at the bid at 6,052.50. That is 3.4 times, an imbalance. One row down, 340 bought against 150 sold is 2.3 times, which is a lot of buying but not an imbalance at three to one. Sell imbalances work the same way in the other direction: the bid at one price against the ask one tick above it.
Stacked: one side, several prices in a row
One imbalance can be a single large order. Three or more on the same side, at adjacent prices, is different. It means the aggressive side took several prices in a row, one after another, without the other side standing in the way. That is urgency, and it is what traders mean by a stacked imbalance.

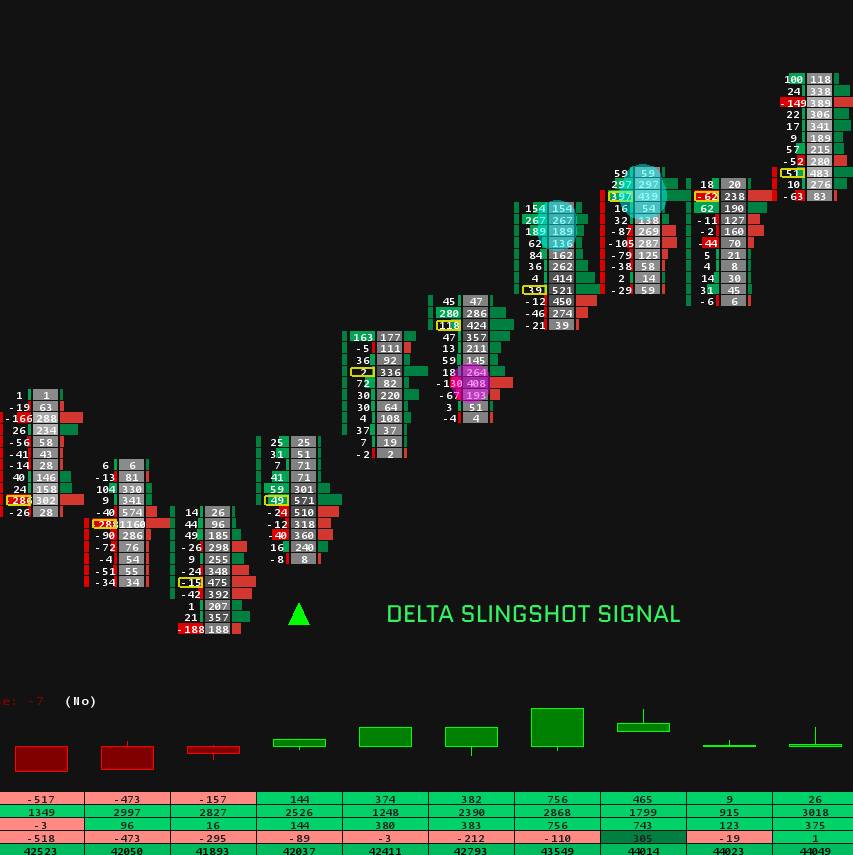
The first two bars in the diagram trade inside a range: two way business, no imbalances, delta close to zero. Then bar 3 breaks out. Buyers lift every offer from 6,044.00 to 6,045.50, four buy imbalances stacked on top of each other, and the bar ends with delta of plus 875 on more than twice the volume of either range bar. Buyers did not wait for sellers to come to them. They went and took the price.
The stack also marks a price zone, shaded in the diagram. That zone is where the urgent buyers got their fills, and it does not disappear when the bar closes. In bar 4 the market comes back into it for the first time, and sellers get nowhere: delta is slightly positive and the low holds at the bottom of the zone.
The zone a stack leaves behind
The traders who built a stack are now holding positions from inside that zone. When the market returns to it, they decide what happens next, and the first return usually tells you who is still in control.

Defended. On the left, the first pullback reaches the zone and stops there. The buyers who stacked defend their entry, new buyers treat the zone as support, and the move carries on. On a footprint you would expect selling to dry up in the zone and buying to return, the way it did in bar 4.
Sliced through. On the right, the first return goes straight through the zone. Nobody defends it. The buyers who stacked are now holding losing positions, and their exits add to the selling on the way down. This is the same trapped trader idea from the absorption lesson: when the side that showed urgency gets no result, it becomes fuel for the other side.
Either way, the zone has given you information. A defended zone confirms the stack. A zone that fails turns the stack into a trap.
When stacked imbalances mislead
- At the end of a long move. A stack of buy imbalances after a long rally, right at a new high, can be the last buyers chasing rather than new ones arriving. If the next bars cannot go higher, it is closer to the liquidity grab than to a breakout.
- On tiny volume. Six contracts against two is three to one. It is also nothing. A stack built from small numbers in a quiet market says very little, which is why a minimum volume filter matters.
- Against zero. When one side traded nothing at a price, any volume on the other side is an infinite ratio. Counting those as imbalances makes stacks appear everywhere in thin trading.
- In thin sessions. Overnight and around holidays, a few aggressive orders can stack imbalances that would mean little during the day session.
- Inside a range. A stack that stays inside an established range often gets absorbed on the next swing. Stacks that break out of something carry more weight.
Reading stacks with the rest of the series
A stacked imbalance is one more reading of effort, and it works best alongside the others:
- Location. A stack that takes out one of the reference levels from the last lesson, such as yesterday's high or the edge of the value area, means more than one in open space.
- Result. Effort should produce a result. A stack that moves price and holds it is a breakout. A stack that moves price and gives it all back in the next bar is effort without result, the absorption pattern again.
- Delta. A stack of buy imbalances in a bar that still closes with negative delta, or a stack at a high while cumulative delta makes a lower high, is the kind of disagreement covered in the delta divergence lesson.
- The first return. As in every lesson, the next bars decide. Watch what the market does the first time it comes back to the zone.
The settings that decide what you see
Whether a stack shows up on your chart depends on four choices, and it is worth making them deliberately:
- The ratio. Three to one, 300%, is the common starting point and the one used in every diagram in this series. Lower ratios mark more imbalances and more noise.
- The minimum volume. A floor on the volume at both prices keeps small numbers from counting.
- How many prices make a stack. Three adjacent prices is the usual minimum.
- Zero comparisons. Decide whether a price where one side traded nothing can count as an imbalance. Leaving it off is the quieter choice.
Seeing it in Sierra Chart
Single imbalances are part of the footprint itself. Our footprint setup guide covers the Numbers Bars setting that colours a cell when one side dominates by a chosen percentage.
For stacks, Sierra Chart has a built-in study called Volume at Price Threshold Alert V2. Its documentation describes using it to highlight multiple adjacent bid or ask dominant prices, which is a stacked imbalance. The inputs map straight onto the settings above:
- Comparison Method set to Ask Volume Bid Volume Diagonal Ratio compares the ask at one price with the bid one tick below, as in the first diagram, with the ratio set in Percentage Threshold.
- Minimum Volume Value for Ratio Comparisons is the volume floor.
- Enable Zero Bid/Ask Compares decides whether comparisons against zero count.
- Highlight Adjacent Alerts Minimum Group Size set to 3 marks only groups of three or more adjacent prices.
The same study can draw extension lines from the stacked prices that run forward until a later bar trades into them, which is the zone idea from this article drawn on the chart.
Our Stack Imbalances Master template comes with this built: it marks stacked buy and sell imbalances as zones, works on time, tick, range and footprint charts, and is meant to be read alongside volume and TPO levels. More ready layouts are in our footprint chart templates, and the rest of our studies are in the Sierra Chart indicators collection.
Across eight lessons, the same question has come back every time: did the effort produce a result? Accumulation, reversals, liquidity grabs, weak pullbacks, absorption, divergence, reference levels and now stacked imbalances are all ways of asking it, at different scales and in different places on the chart.
Trading futures involves substantial risk of loss and is not suitable for every investor. This article is education, not trading advice.