




Market Profile TPO in Sierra Chart: Build Your First Profile Chart

A Market Profile turns a trading session into a shape you can read: where the auction spent its time, where it found acceptance, and where it was rejected. Sierra Chart draws this with the TPO Profile Chart study, and this guide takes you from an empty chart to a working profile saved as a chartbook, using only standard menus. If you followed our footprint setup guide, the rhythm will feel familiar: one trap to avoid first, then a handful of settings that matter.
What you need before starting
- A service package that includes the study. The TPO Profile Chart is part of Sierra Chart's advanced feature set, available from the Advanced packages upward. The official packages page lists what each tier includes.
- Intraday data for your instrument. Profiles are built from intraday activity, so you need a connected data feed. For CME futures such as ES and NQ that means the Denali feed on an Integrated package.
- The official reference. The TPO Profile Chart documentation covers every input; this guide covers the ones that produce a readable profile today.
Step 1: check Tick Size and Session Times first
Two chart settings decide whether your profile is right or broken, and both live in Chart, then Chart Settings. First, Tick Size: the profile stacks its letters in price increments taken from this value, and a wrong tick size produces profiles that look wrong and calculate slowly. For ES it is 0.25. Second, Session Times: the profile is built per session, so the Start Time and End Time define where one profile ends and the next begins. Decide whether you want the full session or only the regular trading hours before you build anything on top.


Step 2: add the TPO Profile Chart study
Open Analysis, then Studies, select TPO Profile Chart from the available studies, and add it. The chart redraws as a profile: a stack of letters or blocks per session instead of bars. If it looks compressed or empty, revisit step 1 before touching any study setting, the cause is almost always there.

Step 3: the first settings, in the order you meet them
Open the study settings. The inputs at the top of the list are, in order, everything a simple profile needs:

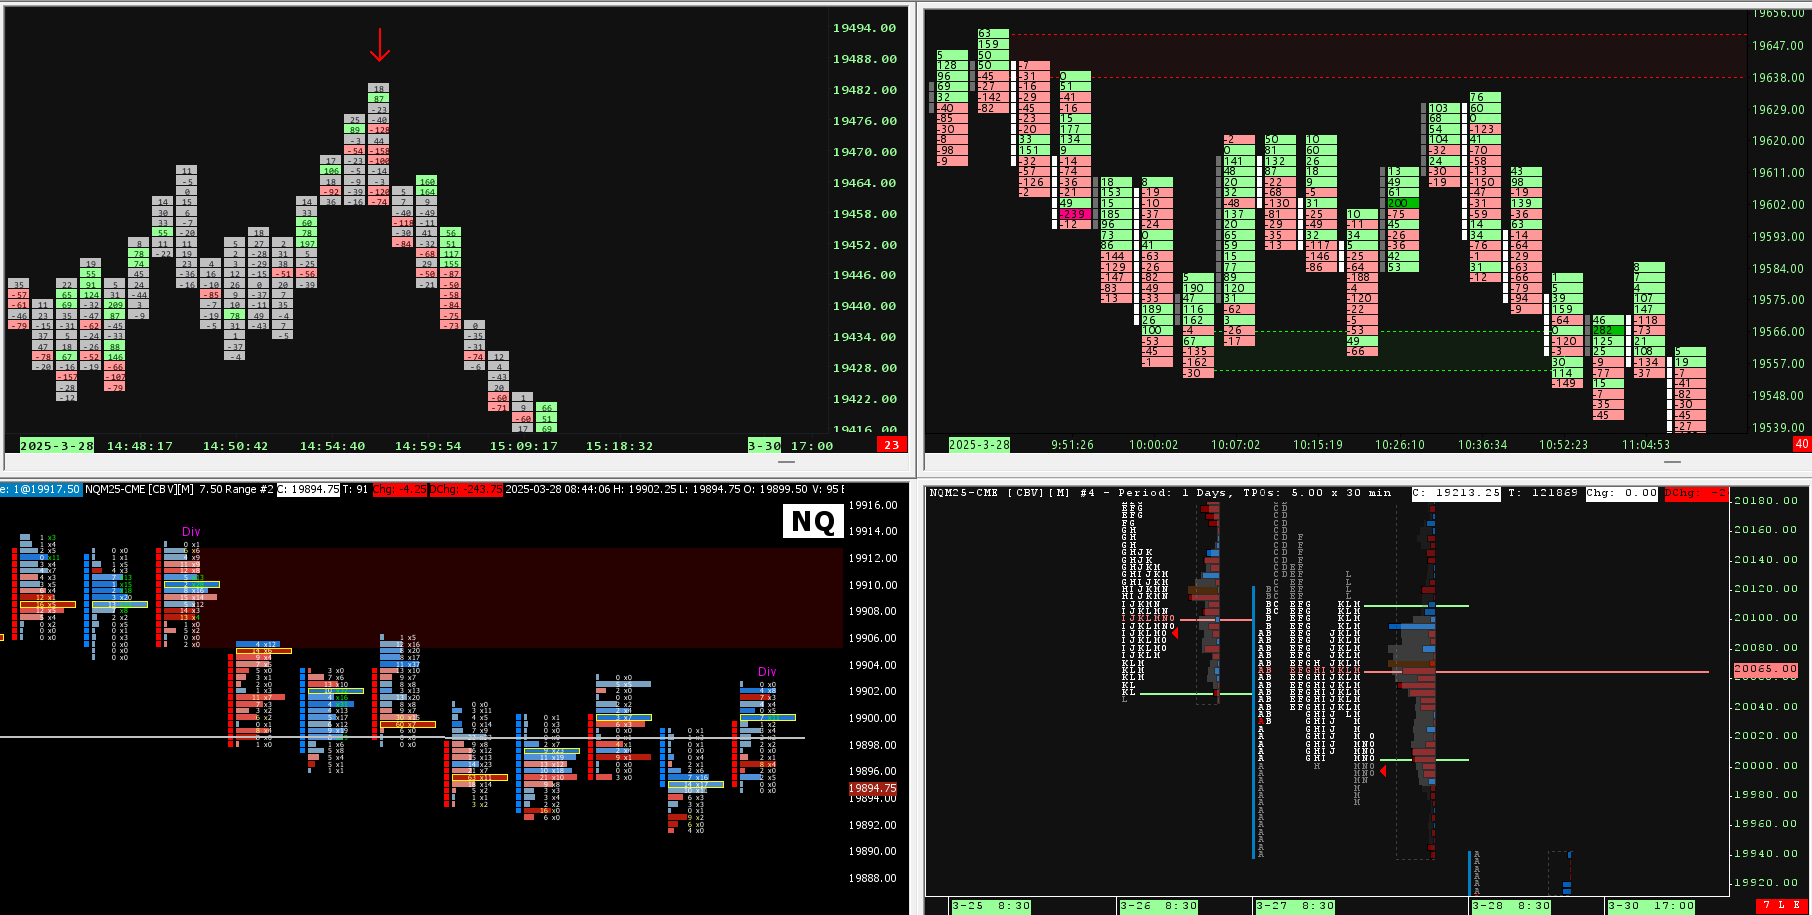
- Letter/Block Price Increment in Ticks. The vertical resolution of the profile. At 2 on ES, each row covers two ticks, 0.50 of price, which keeps a full session compact and readable. If your profile is a wall of thin rows, raise this number. The chart title bar confirms the result, showing the combination as TPOs: 0.50 x 30 min.
- Profile Time Period Length and its Unit. One Day is the classic Market Profile. The same study draws weekly or monthly composites by changing these two, which is how longer term value maps are built.
- Number of TPO Profile Periods. Set to multiple periods, the chart draws one profile per session across its whole history, which is the day after day view you want for context.
- TPO Letter/Block Time Period Length. Each letter represents one sub period, 30 minutes by default, the convention from the trading floor. Shorter periods give more granular profiles at the cost of visual noise.
- Sub Period Price Display Style. Letters is the traditional display and makes the time sequence readable, A then B then C. Blocks gives a cleaner shape once you no longer read individual periods. Both carry the same information.
- Value Area percentage. In the study inputs this appears as Volume Value Area %, set to 70 by convention: the share of the profile counted as the Value Area. The study derives the Point of Control and the value area boundaries from it.

Step 4: read what the auction left behind
Four structures carry most of the information. The Point of Control is the price where the session spent the most time, the fairest price of the day. The Value Area holds the chosen percentage of activity around it, and trading above or below it frames the next session's context. Single prints, prices touched in only one sub period, mark fast moves the auction never revisited. Poor highs and lows, flat edges where several periods share the extreme, suggest unfinished business at the boundary. None of these are signals on their own; they are the vocabulary the profile speaks.

Step 5: save the chartbook, split and merge later
Save the workspace with File, then Save Chartbook As, and you have a Market Profile template you can reopen any day. Worth knowing early: right clicking a profile offers Split Profile Here and Merge with Prior Profile, which is how traders separate a news spike from the rest of the day or build multi day composites by hand.

From one profile to a complete TPO workspace
What you built shows one instrument, one session at a time. The step up is context: the current profile next to weekly and monthly composites, value areas carried forward as levels, and a DOM tied to the same session. That arrangement, tuned per instrument, is what our Market Profile TPO templates deliver, from the NQ optimised TPO template to the SP500 daily, weekly and monthly profile set. The full range of workspaces lives in the Sierra Chart templates catalog.
Quick answers
My profile is too tall and unreadable, what do I change?
Raise Letter/Block Price Increment in Ticks in the study settings. Each step up halves the rows the profile needs, and most instruments read best between one and four ticks per row.
Why does my profile look wrong or load slowly?
Check Tick Size in Chart Settings first. A tick size smaller than the instrument's real increment multiplies the rows the study has to draw and distorts the shape.
Letters or blocks?
Letters while you are learning, because the time sequence stays visible. Blocks once you read profiles by shape. The information is identical.
Can one chart show weekly or monthly profiles?
Yes. Profile Time Period Length with its unit turns the same study into weekly or monthly composites, and many traders run one chart per timeframe side by side.
Does the profile need the full session?
It needs whichever session you decided to trade. Regular hours only and full session profiles both work; what matters is choosing deliberately in Session Times, because the shape changes with the boundaries.