




Before you leave...
Check our Sierra Chart Suite PRO

Custom Study for Sierra Chart


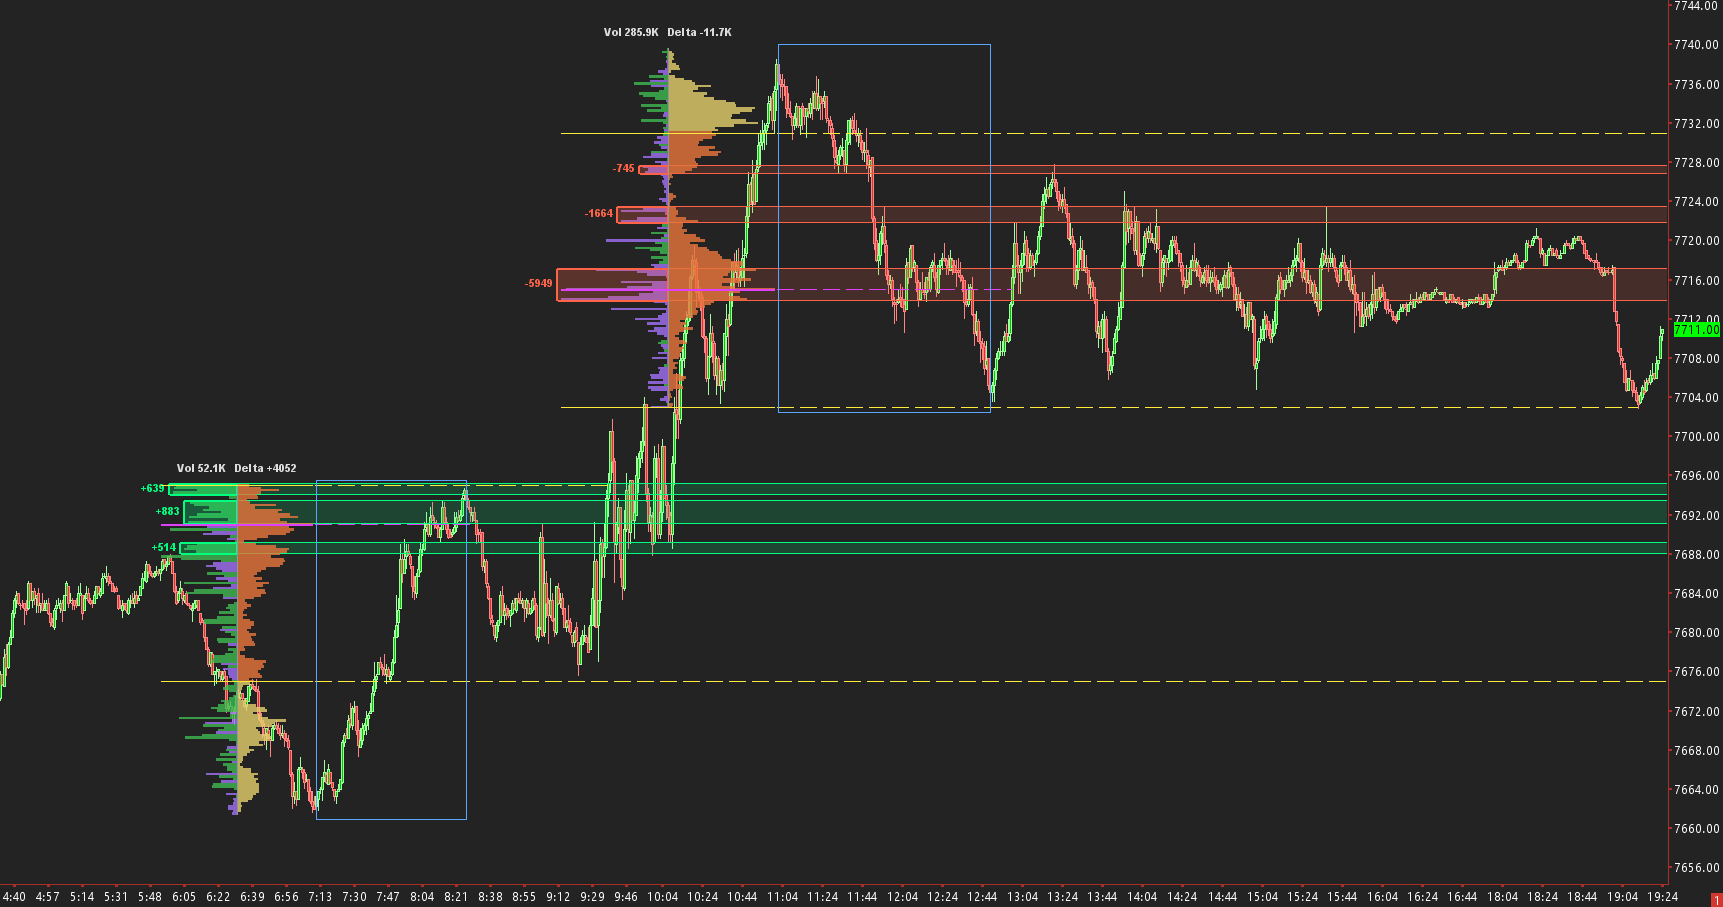
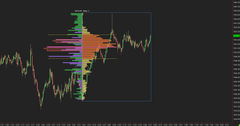
Split Delta Profile puts delta on one side of a middle line and volume on the other, for any range you choose: right-click, click the first bar, click the last. The POC, the value area and the strongest delta clusters are marked for you. And every profile is saved, so it is still there tomorrow.
A middle line splits every price row. Delta grows out to the left: green where buyers lifted the offer, purple where sellers hit the bid. Volume grows out to the right: orange inside the value area, yellow outside it. Runs of big one-sided delta get a box.
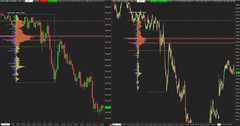
As many profiles as you want. Put one on every session, swing or news move: each keeps its own POC, value area, totals and delta clusters, like the two here.
A live profile. Click one bar and it grows with every new trade: here two seller clusters sit at and just above the POC, between the yellow VAH and VAL lines.
Copied to your other charts. Draw a profile once and, with one setting, it also shows on your other charts of the same symbol: here a 5-minute and a 1-minute chart, same time, same totals.
7 color schemes, or your own colors. Here Molten, Neon and Trading Floor on a dark chart, and Daylight on a white one: one setting recolors the whole profile, text included.
Every profile is saved by date and time for its symbol, so it comes back after a restart and covers the same trades on any bar period.
A volume profile shows where the market traded. Delta shows which side was pushing. To read a level you need both, on the same row.
A volume profile shows how much traded at each price, but not which side was the aggressor there.
Where delta is shown, it is usually a colored slice of the volume bar, or a column of small numbers.
A heavy run of selling across a few prices looks like any other row, unless you compare every row yourself.
Pick Split Delta Profile: New (click 2 bars). A banner at the top of the chart says what to click next.
Any bar you like: the open, a news spike, the start of a move. A dashed line marks it.
The profile appears at once, with its POC, value area, totals and delta clusters. Esc cancels at any point.
Or pick New to Live Bar (click 1 bar): the profile runs from that bar to the newest one and keeps growing. Clear All removes every profile on the chart in one step.
Pick one of three detection modes. Each profile puts a box around its strongest clusters, prints the total delta beside each box, and carries the zone forward on the chart.
Strong rows on one side, close together: where one side hit hard.
Many rows in a row on one side, even small ones: where one side kept pushing.
A same-side run with big rows inside: the push lasted, and it was strong.
Never a fixed number of contracts, so the same settings fit ES or CL, a quiet session or a busy open.
The cluster's net delta prints next to it, in the buyers' or the sellers' color.
A see-through band carries each cluster to the right edge, or stops where price trades in the zone again.
Keep the candles in view, or put the profile right on them. Before the first bar, the middle line on the first or the last bar, the middle of the range, or after the last bar.
Zoom the price scale and nothing jumps. The POC, value area and delta clusters are worked out on fixed rows, so they keep their prices however far you zoom.
See which levels price has not been back to. The POC, VAH and VAL run to the right as dashed lines and stop at the first bar that trades there.
Draw it once. Profiles are saved with the symbol and come back after a restart. One setting shows them on your other charts of that symbol, on any bar period.
One setting recolors everything. Molten, Neon, Glacier, Gemstone, Trading Floor, Clear Sight for colorblind traders and Daylight for white charts, or every color set by hand.
Runs at Sierra Chart's own speed. It reads Sierra Chart's own volume at price data, so there is nothing else to install or run.
From the right-click to the finished profile, then the POC, value area and delta, the 3 detection modes, live profiles, other charts and color schemes.
Placement, width, row size, value area, line extensions, text and every delta cluster rule can be changed. The defaults are ready to use, so you only change what you want.
Every input says what it does, such as Positive Delta Color (more at the ask), and the user guide explains each one. Pick one of the 7 color schemes, or Manual to set every color yourself.
One-time payment. Lifetime updates. No subscriptions, no recurring fees.
Get The Study Now Questions before you buy? Ask usSplit Delta Profile is a chart analysis study. It draws the volume and the delta that traded at each price over the bars you choose. It does not predict price, and it is not a trading system, financial advice, or a solicitation to trade. Futures trading carries substantial risk of loss and is not suitable for every investor. Past chart behavior does not indicate future results. Requires Sierra Chart, an intraday chart and a data feed with bid and ask volume. Delta needs tick data: Intraday Data Storage Time Unit set to 1 Tick.
Important: Make sure you have updated to the latest version of Sierra Chart
After purchasing one of our indicators, please contact us and provide your Sierra Chart username so we can activate the indicator. Once it has been activated, restart your Sierra Chart platform.
Next, open Sierra Chart and the chart where you want to add the indicator:
1. Go to Analysis in the top menu bar.
2. Click on Studies.
3. In the "Studies" window, click Add Custom Study....
4. Find your new indicator in the list , select it, and click Add.
Template included with the indicators:
Copy the template file received by email template.cht into your C:\SierraChart\Data\ folder. Restart your Sierra Chart platform, open the Chartbook
To get the most out of our Sierra Chart templates, you need at least the following subscription:
“Integrated Sierra Chart with Advanced Features (Service Package 5) at 36 USD”.
We also recommend purchasing the “Denali Exchange Data Feed” data source, for access to accurate, professional market data.
(Denali : 11usd with a Stage5 broker account)
Our templates are available as one-time purchases, meaning you pay once and own the template indefinitely. There are no monthly subscription fees associated with our products, allowing you to use them without ongoing costs.
- Be sure to update to the latest version of sierrachart.
- Copy the template file received by Email, template.cht into your \SierraChart\Data\ folder.
- Restart your Sierra Chart platform and open the corresponding Chartbook.
No. We don't offer short trials on our indicators or templates.
A few days of market is too small a sample to judge a trading tool. Conditions change from week to week, some setups may not appear at all inside a trial window, and it takes time to see how a tool behaves on a trend day, a range day or a slow session. A 3 to 7 day trial mostly tells you which sessions you happened to get.
Questions before you buy? Email contact@sierachart.com with what you trade and how your chart is set up, and we'll tell you straight whether it fits.
We are committed to providing high-quality templates. Refunds are only issued for verified technical issues with our products. Technical support is available to assist you in resolving any problems you may encounter.
Our team of traders and Sierra Chart experts also offers personalized coaching to help you get started with the Sierra Chart platform.
Our templates are optimized and configured to work on a specific market (NQ, ES, ZN, Gold...). However, if you have advanced knowledge of your market and SierraChart, it is possible to modify the settings to match the characteristics, schedules, etc. of another market.
Thanks for subscribing!
This email has been registered!
| Product | SKU | Description | Collection | Availability | Product Type | Other Details |
|---|