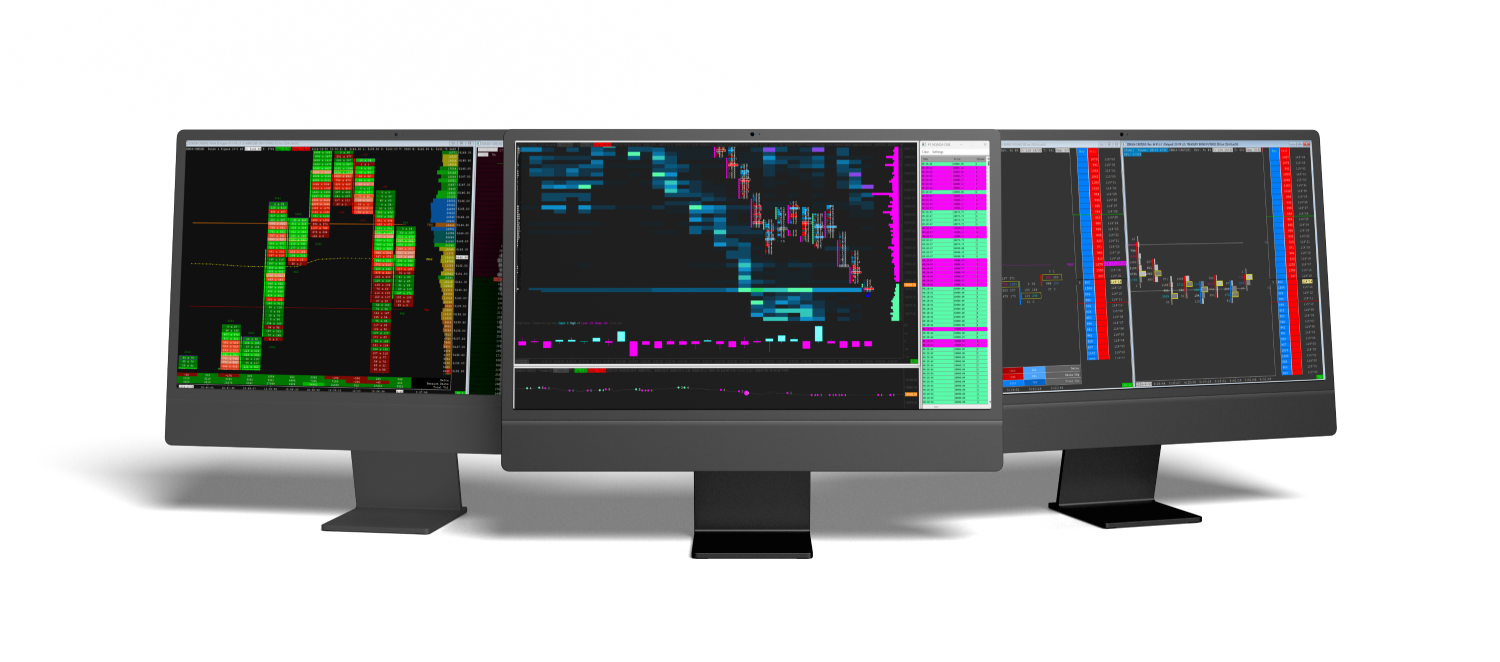
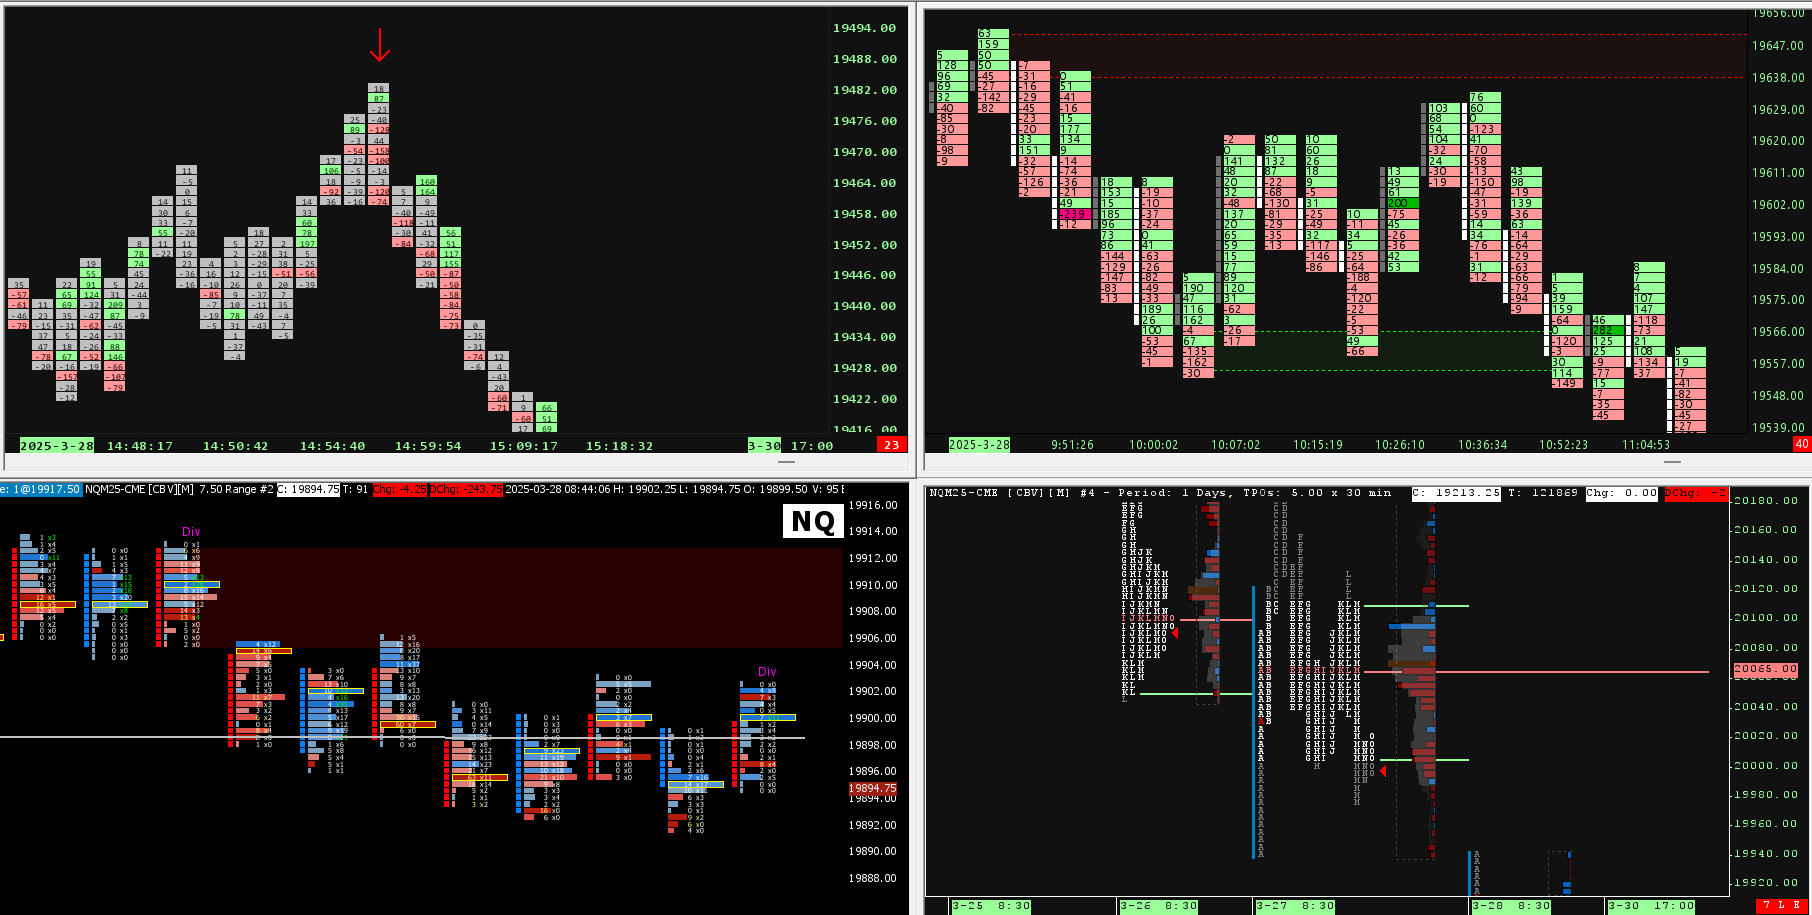
Sierra Chart Indicator Bundle

SieraChart Orderflow Suite Indicators

Eight Sierra Chart indicators that mark order flow events on your chart, from trapped traders and delta flips to order gaps and delta divergences. A 3 column footprint template comes with them.

$149.90$199.90Save $50One-time payment, lifetime access and updates

See What's Inside
Sierra Chart footprint on ES with Orderflow Suite markers: red and green dots, a red triangle and shaded levels Enlarge
  • 8 Order Flow Indicators
  • 3 Column Footprint Template Included
  • Lifetime Updates
  • One-Time Purchase

A Footprint Prints Faster Than You Can Read It

The events worth noticing are in the numbers. The suite marks them on the chart, and the reading of the context stays with you.

Hundreds Of Numbers

Every bar prints bid, ask and delta at each price. In a fast session that is too much to scan live.

Events Pass Quickly

A delta flip at a new high or a wick full of trapped traders is easy to spot once price has moved on.

A Different Check Each Time

Divergence, delta spikes and a point of control outside the body each need their own rule, on every bar.

What's Inside

Eight Order Flow Indicators In One Suite

Each one marks one kind of event on your chart. Click any chart to see it full size.

Footprint chart in Sierra Chart with red and green bands extending to the right from flagged imbalance levels Enlarge
Strong imbalances on a footprint. Red and green bands run to the right from the flagged levels, so they stay on the chart as price moves on.
01

Absorption / Trapped Traders

Marks strong imbalances and the large participants likely trapped by them.

  • Strong imbalances drawn with extension lines you can customize.
  • Imbalance size parameters you can adjust.
  • Detects trapped traders in wick candles and below the point of control.
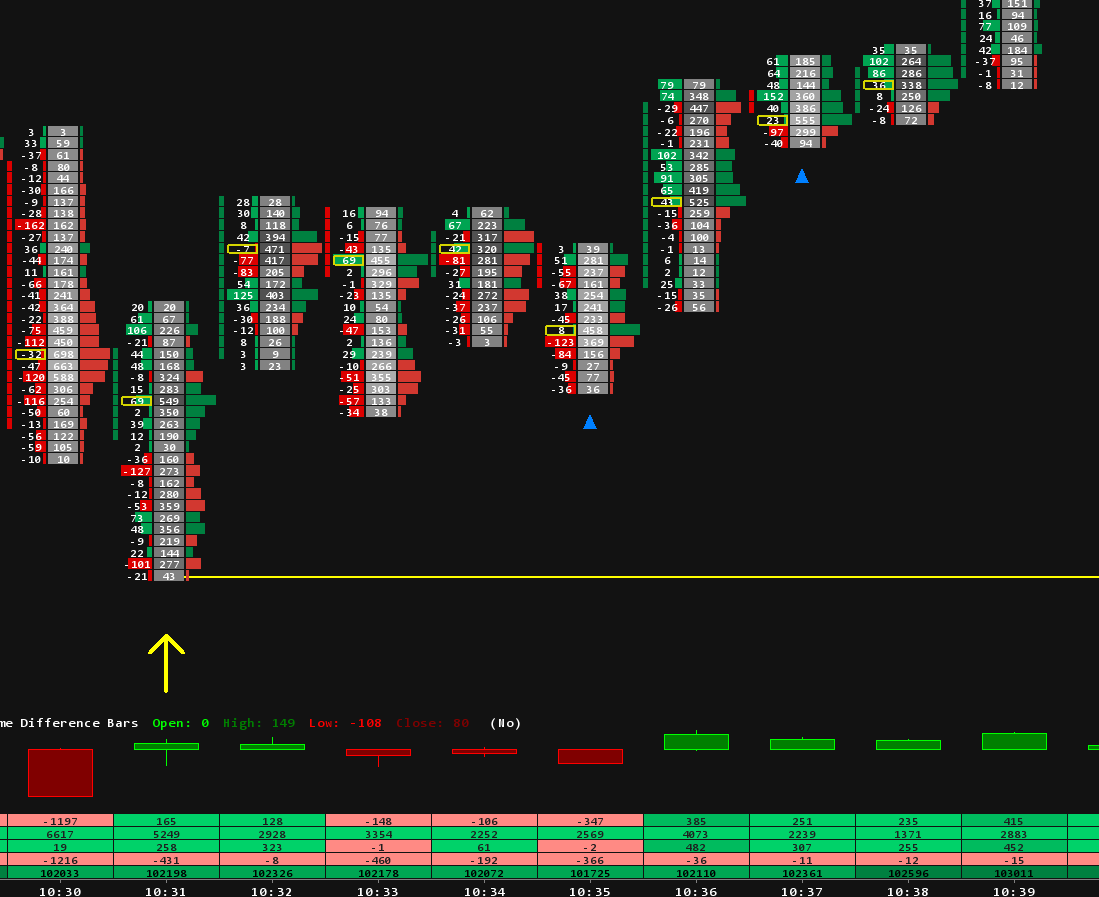
Delta Flips on a Sierra Chart footprint: yellow arrows above two highs with lines running forward Enlarge

On a footprint. Yellow arrows above two highs, each with a line running forward from the level.

Delta Flips on a Sierra Chart candlestick chart: yellow arrows at highs and lows with lines running forward Enlarge

On candlesticks. Arrows point down from highs and up from lows, with lines running forward from the levels.

Delta Flips study inputs in Sierra Chart: high and low period mode, lookback, reversal bar, extension lines, symbol offset, signal on close Enlarge

The inputs. Lookback in bars or minutes, reversal bar, extension lines, symbol offset and signal on close.

02

Delta Flips

Marks delta flipping at new highs and lows, with a line projected forward from the level.

  • Detects delta flips at new price highs and lows.
  • Extension lines as potential support and resistance, on or off.
  • Lookback set in bars or in minutes.
  • Reversal bar requirement, on or off.
Delta Breakouts on a Sierra Chart footprint: blue arrows under three bars with large positive delta Enlarge

On a footprint. Blue arrows sit under the three bars with the largest positive delta in the row below the chart: 204, 173 and 164.

Delta Breakouts on a Sierra Chart candlestick chart: blue arrows below bars and red arrows above bars Enlarge

On candlesticks. Blue arrows below the bars for positive delta, red arrows above them for negative delta.

Delta Breakouts study inputs in Sierra Chart: average length, multiplier, symbol offset, signal on close Enlarge

The inputs. Average length in bars, multiplier, symbol offset and signal on close.

03

Delta Breakouts

Marks the bars where delta runs well above its own recent average.

  • Signals when current delta is a set multiple of the average, positive or negative.
  • Average length in bars, set by you.
  • Delta multiplier, set by you.
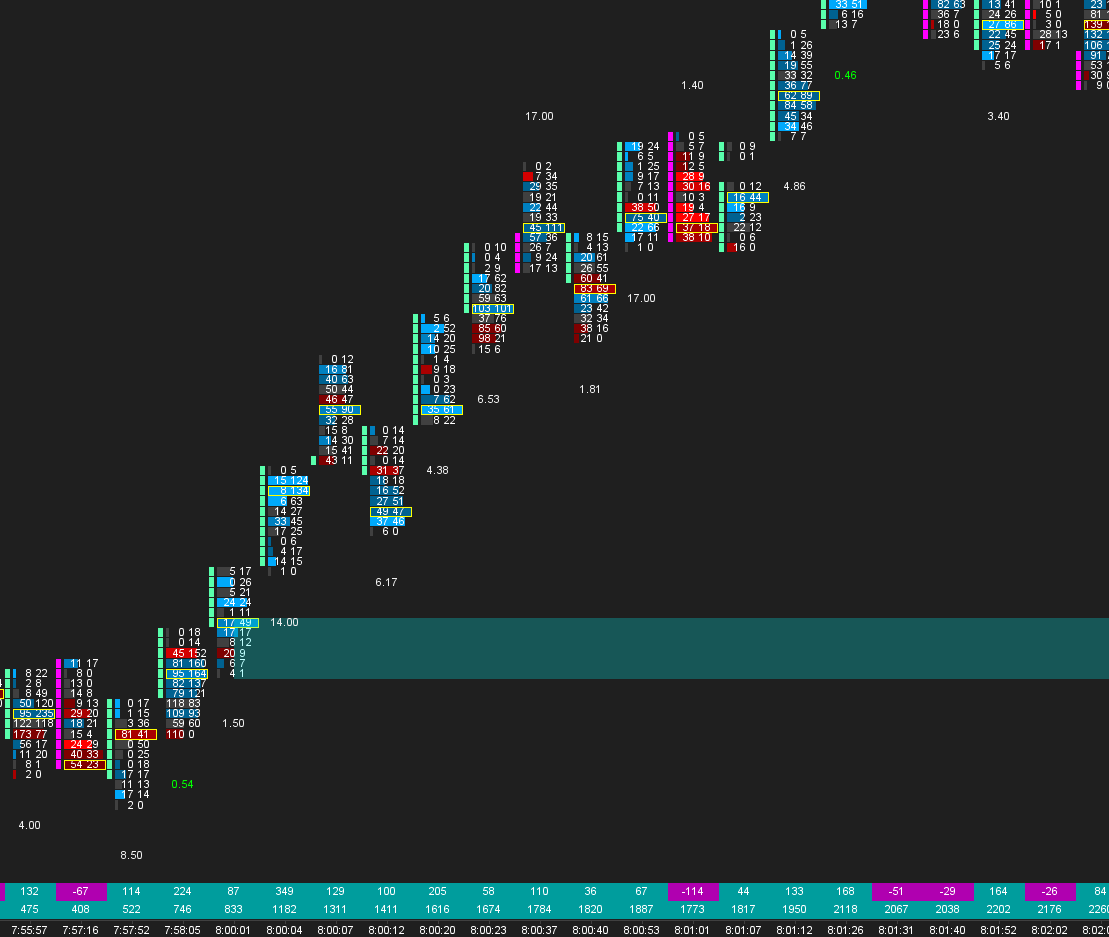
Order Gaps on a Sierra Chart footprint: blue triangles under two bars Enlarge
Bullish order gaps on a footprint. Blue triangles under two bars. The yellow arrow and line come from Delta Flips.
04

Order Gaps

Flags the bars where the point of control sits outside the candle body.

  • Bullish order gap: the point of control is below the candle body.
  • Bearish order gap: the point of control is above the candle body.
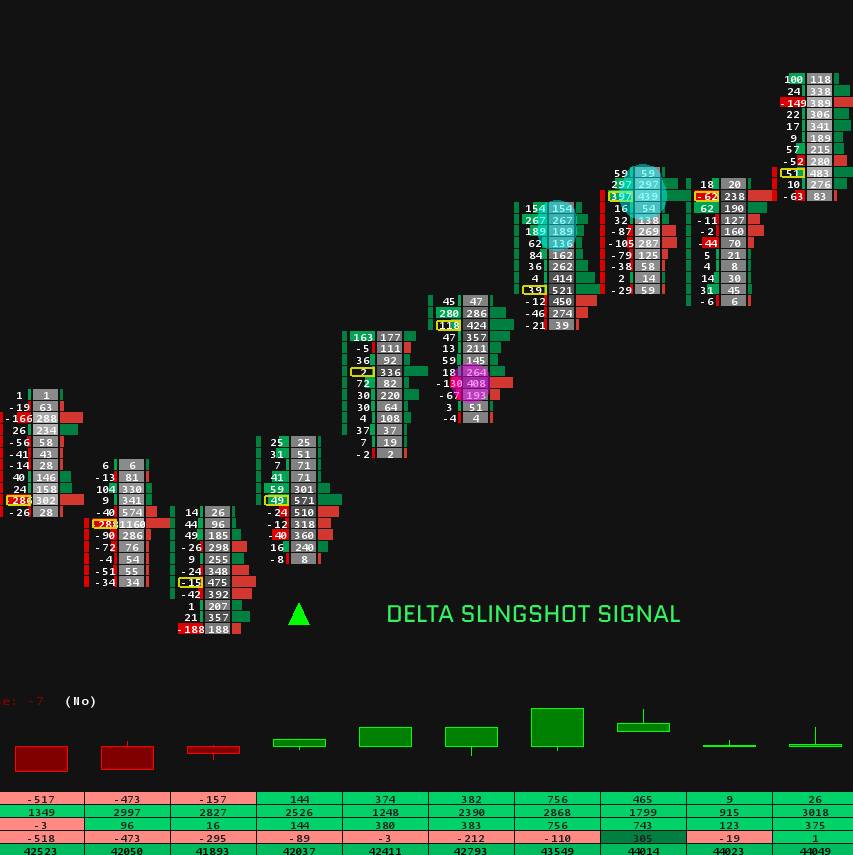
Bearish SlingShot on a Sierra Chart footprint: a red triangle above the bar right after the high Enlarge

Bearish, on a footprint. A red triangle above the bar right after the high.

Bullish SlingShot on a Sierra Chart footprint: a green triangle under the bar where the move up starts Enlarge

Bullish, on a footprint. A green triangle under the bar where the move up starts.

SlingShots on a Sierra Chart candlestick chart: a green triangle below a low and a red triangle above a high Enlarge

On candlesticks. A green triangle below a low and a red triangle above a high.

05

SlingShots Reversal Signals

Marks potential reversals by combining a price action pattern with volume and delta.

  • Adapts to market volatility: no fixed volume or delta thresholds to set.
  • Combines volume analysis with a price action pattern.
Delta Divergence on a Sierra Chart footprint: a green dot under a bar with negative delta Enlarge
A bullish divergence on a footprint. A green dot under a bar whose delta reads -265 in the row below the chart.
06

Delta Divergence

Marks the bars where price and delta disagree.

  • Bullish delta divergence: negative delta on an up move, marked with a green dot.
  • Bearish delta divergence: positive delta on a down move, marked with a red dot.
07

Delta Tails

New add-on.

08

Clean Finish Auctions

New add-on.

Included Free

3 Column Footprint Template

A footprint template that opens already set up in Sierra Chart. It comes with the suite at no extra cost.

  • 3 columns of data at each price.
  • Volume profiles.
  • Footprint statistics under the bars.
  • Stacked imbalances study.

Built For

  • Intraday futures traders who use a footprint chart in Sierra Chart.
  • Traders who want these events marked on the chart instead of scanning every bar for them.
  • Traders who read the context themselves. The suite marks events, it does not tell you what to trade.

What You Need

  • Sierra Chart with Advanced Features: Service Package 5 or higher.
  • A data feed with bid and ask volume, such as Denali.
  • Footprint charts set to store 1-tick intraday data.
  • Windows. On a Mac, Sierra Chart runs in a Windows virtual machine such as Parallels: see our Mac guide.
What You Get

Everything In The Suite

  • 8 order flow indicators Absorption / Trapped Traders, Delta Flips, Delta Breakouts, Order Gaps, SlingShots, Delta Divergence, Delta Tails, Clean Finish Auctions, activated on your Sierra Chart username
  • 3 column footprint template bonus, ready to open in Sierra Chart
  • Support by email
  • Lifetime access and lifetime updates
One-time payment$149.90

Secure checkoutAmerican Express Apple Pay Diners ClubDiscoverGoogle Pay JCBMastercard Visa

FAQ

I placed an order, now what?

Email your Sierra Chart username to contact@sierachart.com with the subject Activate Indicator License. To find your username, open Sierra Chart and go to Help >> About. Once your licence is activated, the indicators are added to your custom studies list. The 3 column footprint template is a chartbook: install it with our chartbook installation guide.

Which Sierra Chart Service Package do I need?

Service Package 5, Integrated with Advanced Features, or higher. Our Sierra Chart pricing guide explains the packages.

What markets does the suite work on?

Futures markets in Sierra Chart whose data feed carries bid and ask volume, such as ES, NQ, DAX, Gold and CL. Inputs such as the lookback and the multiplier can be changed on each chart.

Do your tools guarantee that I will be profitable?

No. No algorithm or indicator can predict financial markets with certainty. The suite marks events on your chart to support your own discretionary trading and your own risk decisions. It is not meant to be followed blindly.

Are there refunds?

All sales are final, because digital products cannot be returned once delivered. The exception is a verified technical issue that prevents proper use of the product, once our support team has had the chance to resolve it. See the refund policy.

Do you offer a free trial?

No. A few days of market is too small a sample to judge an indicator: conditions change, some setups won't appear in a week, and it takes time to see how a study behaves across different sessions. If you have questions before buying, email contact@sierachart.com and we'll answer them.

Does it work on a Mac?

Sierra Chart is Windows software. On a Mac, run it in a Windows virtual machine such as Parallels. Our Sierra Chart on Mac guide covers the options.

Stop Scanning Every Bar By Eye.

One-time payment. Lifetime updates. No subscription.

Secure checkoutAmerican Express Apple Pay Diners ClubDiscoverGoogle Pay JCBMastercard Visa

The SieraChart Orderflow Suite is a set of chart analysis studies. They mark order flow events on your chart. They do not predict price, and they are not a trading system, financial advice, or a solicitation to trade. Futures trading carries substantial risk of loss and is not suitable for every investor. Past chart behaviour does not indicate future results. Requires Sierra Chart with Advanced Features (Service Package 5 or higher), a data feed with bid and ask volume, and charts that store 1-tick intraday data.

SieraChart is an independent developer for Sierra Chart software.