




Before you leave...
Check our Sierra Chart Suite PRO

Custom Study for Sierra Chart


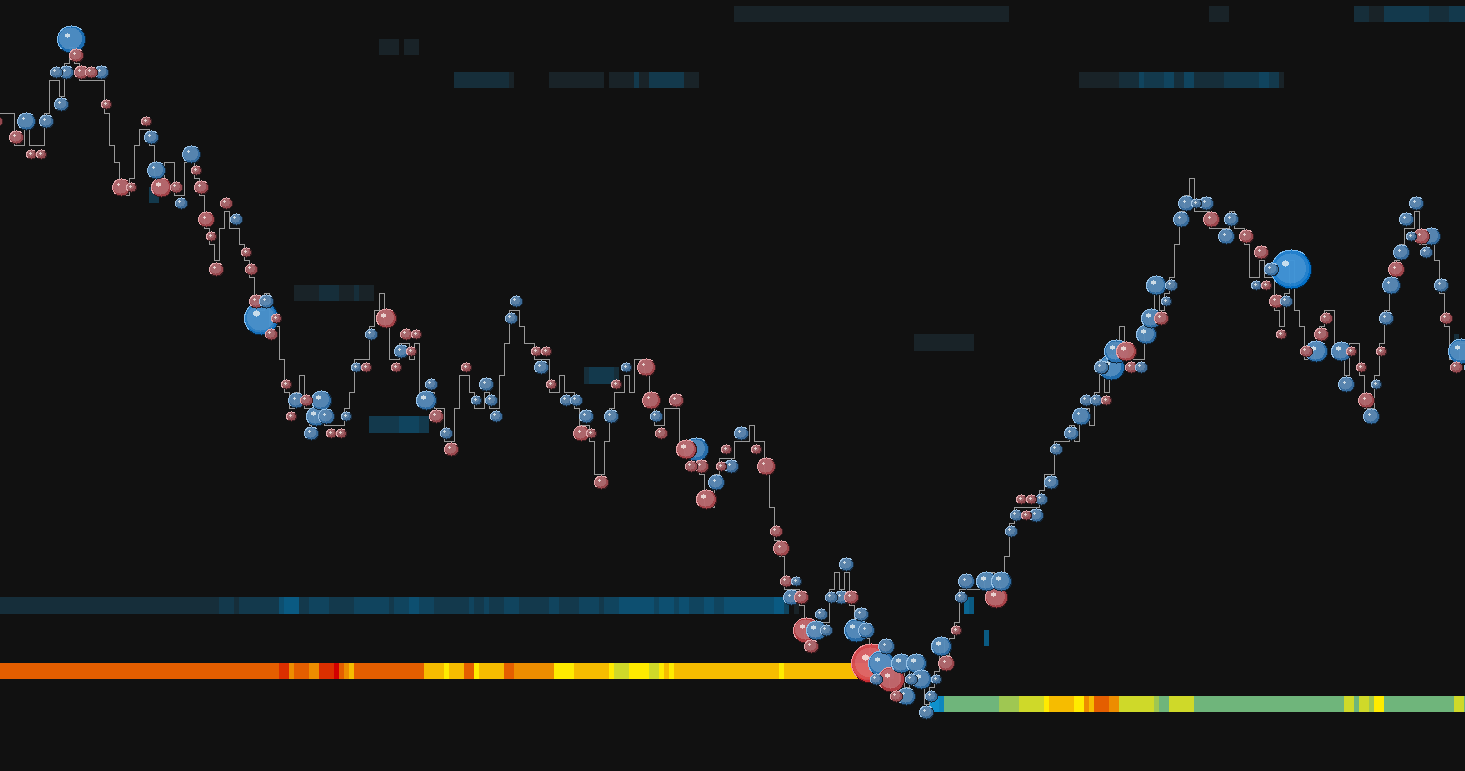
Big Trades Bubbles puts a shaded bubble on the price bar wherever a trade at or above your size went through. The bigger the trade, the bigger the bubble, and the color tells buyers lifting the offer from sellers hitting the bid. Every bubble comes from real trades in your chart's own tick data.
No tape to watch, no numbers to add up. Each bubble sits on the bar and at the price where the big trades went through. Its size is the volume, its color the side that was aggressive.
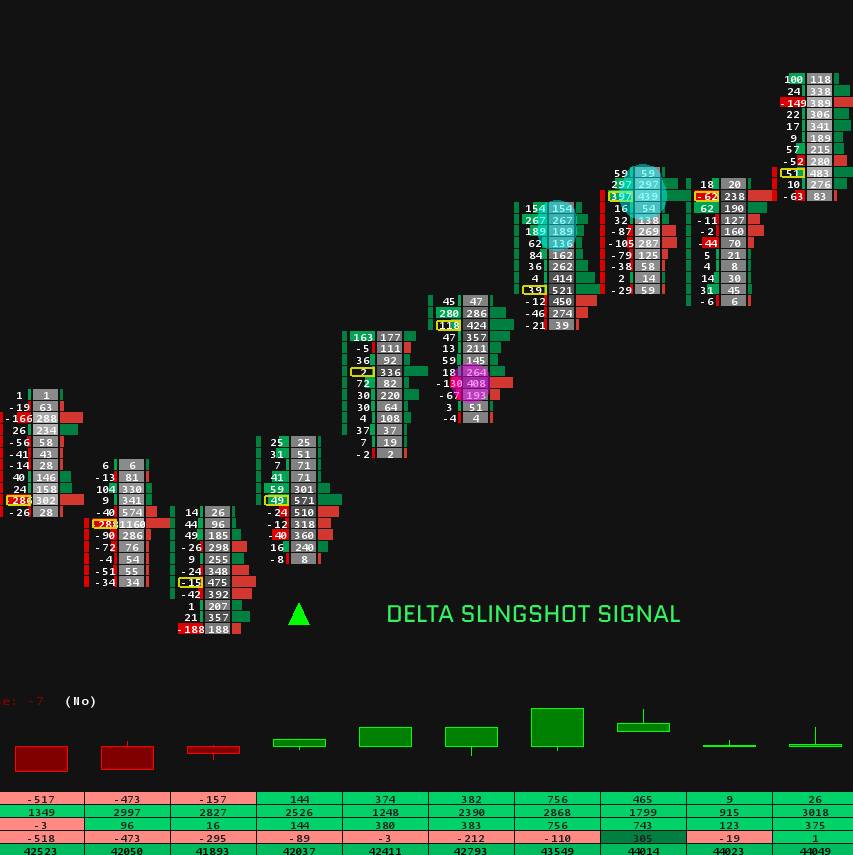
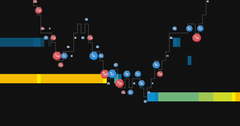
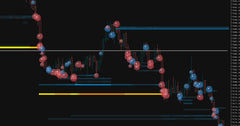
Big trades, sized by volume. Blue bubbles are buyers lifting the offer, red bubbles are sellers hitting the bid, and the bigger the bubble, the more size traded at that price.
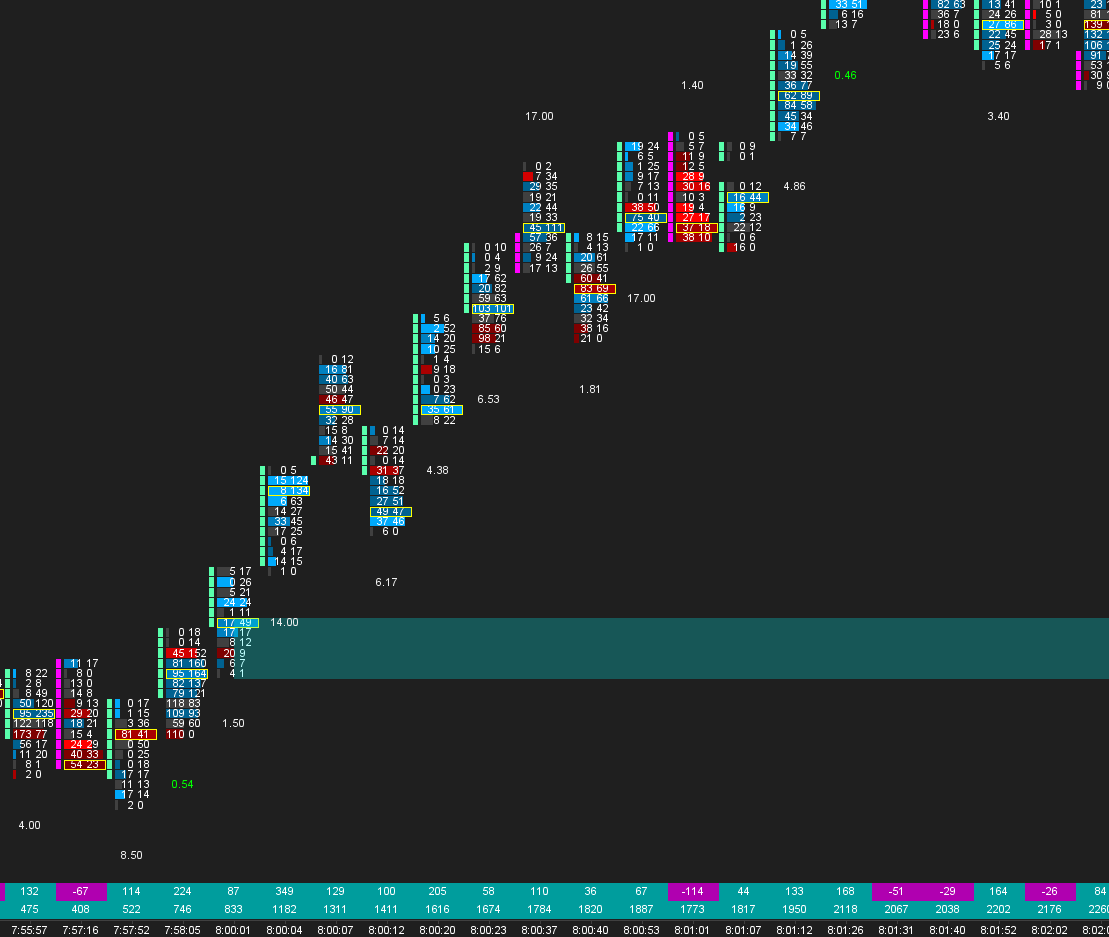
The number on every bubble. Turn on the volume text and each bubble shows its contracts. Here in a Difference mode: buyers minus sellers, so selling shows as a negative number.
See-through bubbles. Set a transparency and the candles show through, so the price action under a big bubble stays readable.
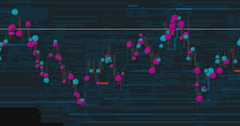
4 bubble styles, 7 color schemes. Here the Dark style with a two-color edge in the Neon scheme. One setting recolors every bubble, the volume text included.
Over a depth heatmap. The chart of the first picture again, with a depth heatmap behind it and a green and red color scheme: trades on top, resting orders behind.
Bubbles come from your chart's own tick data, so they are on the history as well as live, for as many days as you choose (3 by default).
Order flow traders want to know where size traded. Most charts make you dig for it.
A 150-lot market order that meets six resting orders prints as six small fills. None of them looks big.
A footprint adds up every trader at a price. One 300-lot order and a hundred 3-lots look the same.
Time and Sales shows a big trade for a moment. Then it scrolls off, and your candles never show it.
On CME and EUREX data, the fills of one aggressive order at one price are added back together, so a split order counts at its full size.
Only trades at or above your Volume Threshold count. Set it for each instrument, and add a second copy of the study to watch a second size.
The bubble grows with the volume, and its color shows who was aggressive: buyers at the ask or sellers at the bid.
One setting decides what a trade is. Change it any time: the study reads the data again by itself, with no chart reload.
The default. The fills of one aggressive order are added back together: a 150-lot that meets six resting orders counts as one 150-lot trade.
Every fill counts on its own, as the exchange reports it. Only a single fill of your size gets a bubble.
All trades at one price and side within a window you set, 1 second by default, add up. Repeated buying or selling at one price shows as one bubble.
One size always means the same volume. With a fixed volume range, a 300-lot bubble looks the same today and next week, on a linear, square root or logarithmic curve.
Total, largest trade, ask or bid, or the difference. One bubble per price, or one per bar placed at its high, center or low.
A bubble that fits your chart. Light or dark, with or without a two-color edge, solid or see-through so the candles show.
One setting recolors every bubble. Molten, Neon, Glacier, Gemstone, Trading Floor, Clear Sight for colorblind traders and Daylight for white charts, or your own colors.
A copy for each size you watch. Each copy reads the chart's data itself, so 100 lots and 300 lots can share one chart, and a new threshold needs no reload.
Get told when a big trade prints. Set a Sierra Chart alert on the study's values, and print the volume on each bubble when you want the number.
Four minutes on an ES replay: the draw modes, the color schemes, the volume text, the Volume Threshold and What Counts as One Trade.
Set the Volume Threshold for your instrument, pick a draw mode, a bubble style and a color scheme, and you are done. Every other setting starts at a working default, and the user guide explains each one.
Bubble sizes, colors and the volume text all live in the study's own settings, and one color scheme sets every color in one go.
One Sierra Chart setting is required: OpenGL. Use OpenGL for Chart Graphics must be on, in Global Settings >> Graphics Settings - Global >> Other. Without it, the bubbles are drawn white. The user guide shows where it is.
One-time payment. Lifetime updates. No subscriptions, no recurring fees.
Get The Study Now Questions before you buy? Ask usBig Trades Bubbles is a chart analysis study. It marks the trades at or above a volume you choose, from your chart's own tick data. It does not predict price, and it is not a trading system, financial advice, or a solicitation to trade. Futures trading carries substantial risk of loss and is not suitable for every investor. Past chart behavior does not indicate future results. Requires Sierra Chart with OpenGL turned on (Use OpenGL for Chart Graphics), an intraday chart, Intraday Data Storage Time Unit set to 1 Tick, and a data feed that gives the bid or ask side of each trade. Rebuilding orders from their fills needs CME or EUREX data.
Important: Make sure you have updated to the latest version of Sierra Chart
After purchasing one of our indicators, please contact us and provide your Sierra Chart username so we can activate the indicator. Once it has been activated, restart your Sierra Chart platform.
Next, open Sierra Chart and the chart where you want to add the indicator:
1. Go to Analysis in the top menu bar.
2. Click on Studies.
3. In the "Studies" window, click Add Custom Study....
4. Find your new indicator in the list , select it, and click Add.
Template included with the indicators:
Copy the template file received by email template.cht into your C:\SierraChart\Data\ folder. Restart your Sierra Chart platform, open the Chartbook
To get the most out of our Sierra Chart templates, you need at least the following subscription:
“Integrated Sierra Chart with Advanced Features (Service Package 5) at 36 USD”.
We also recommend purchasing the “Denali Exchange Data Feed” data source, for access to accurate, professional market data.
(Denali : 11usd with a Stage5 broker account)
Our templates are available as one-time purchases, meaning you pay once and own the template indefinitely. There are no monthly subscription fees associated with our products, allowing you to use them without ongoing costs.
- Be sure to update to the latest version of sierrachart.
- Copy the template file received by Email, template.cht into your \SierraChart\Data\ folder.
- Restart your Sierra Chart platform and open the corresponding Chartbook.
No. We don't offer short trials on our indicators or templates.
A few days of market is too small a sample to judge a trading tool. Conditions change from week to week, some setups may not appear at all inside a trial window, and it takes time to see how a tool behaves on a trend day, a range day or a slow session. A 3 to 7 day trial mostly tells you which sessions you happened to get.
Questions before you buy? Email contact@sierachart.com with what you trade and how your chart is set up, and we'll tell you straight whether it fits.
We are committed to providing high-quality templates. Refunds are only issued for verified technical issues with our products. Technical support is available to assist you in resolving any problems you may encounter.
Our team of traders and Sierra Chart experts also offers personalized coaching to help you get started with the Sierra Chart platform.
Our templates are optimized and configured to work on a specific market (NQ, ES, ZN, Gold...). However, if you have advanced knowledge of your market and SierraChart, it is possible to modify the settings to match the characteristics, schedules, etc. of another market.
Thanks for subscribing!
This email has been registered!
| Product | SKU | Description | Collection | Availability | Product Type | Other Details |
|---|