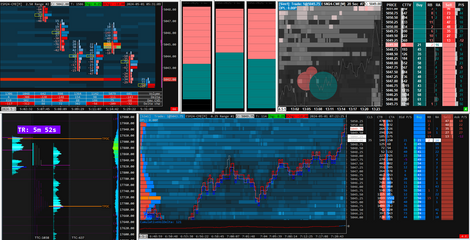


How to Set Up Anchored VWAP in Sierra Chart 2024 for Powerful Technical Analysis 💰📈
As a professional trader, having the right technical analysis tools can give you a significant edge in the markets. One such powerful indicator is the anchored volume weighted average price (VWAP) study available in Sierra Chart. Unlike a regular VWAP that starts from the opening price, an anchored VWAP allows you to set a custom anchor point from which to calculate the volume-weighted average price. This can provide valuable insights into buying and selling pressure relative to that specific price level.
Step-by-Step Guide: Setting Up Anchored VWAP in Sierra Chart 2024
- Access the Studies/Indicators menu in Sierra Chart (via the Analysis > Studies option or right-clicking on the chart)
- Click "Add Custom Studies" and expand the "User Contributed Studies" section
- Locate and add the "eci vwap anchor" study to your list of applied studies

- Right-click on the added study and go to Settings to configure its appearance
- Customize settings like line colors, fill colors, deviation bands, and extensions

- To view multiple anchored VWAPs, duplicate the study and assign a different color scheme
- Use the right-click > "Anchor vwap <xx>" option to set an anchored VWAP from any price point on your chart

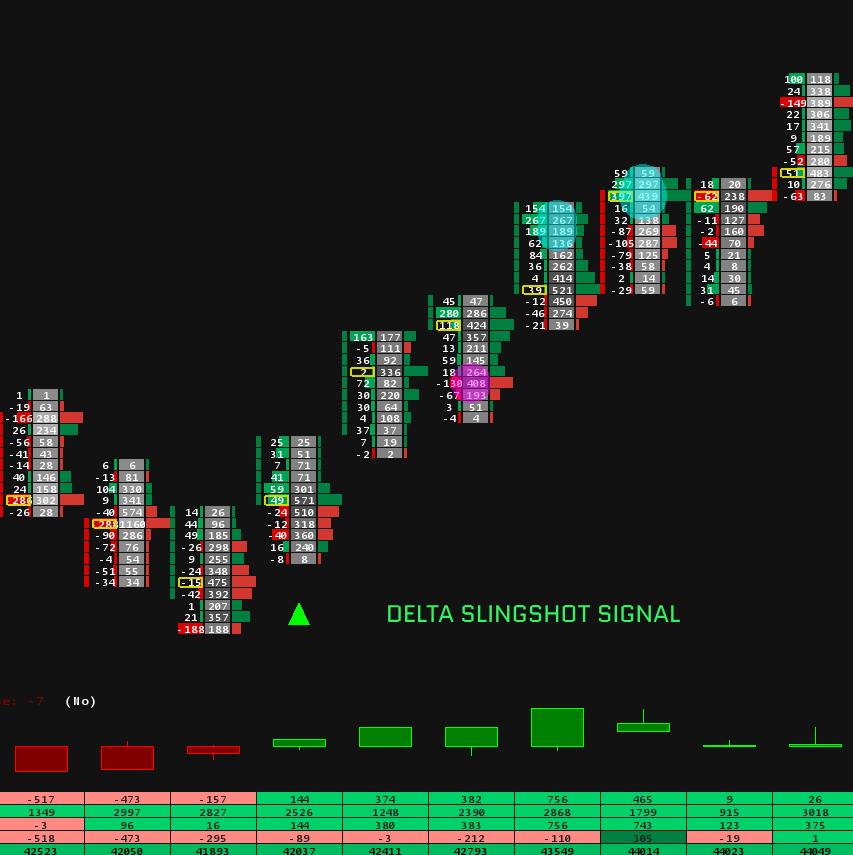
What is Anchored VWAP?
The volume weighted average price (VWAP) is a popular indicator that calculates the average price of a security weighted by trading volume over a given period. The traditional VWAP is anchored from the day's starting point or opening price. However, an anchored VWAP allows traders to set a custom anchor point, such as a major support or resistance level, a swing high/low, or a notable price action event like a breakout or large volume spike.
Benefits of Anchored VWAP:
- 🔺 Visual Tool for Buying/Selling Pressure: Monitor price deviations from the anchored VWAP to gauge intraday buying and selling pressure.
- 🔺 Identify Potential Support/Resistance: Anchored VWAP levels can act as dynamic support or resistance zones.
- 🔺 Spot Divergences for Trade Signals: Crossovers and divergences between price and anchored VWAP can signal potential trade opportunities.
- 🔺 Customizable Settings: Adjust colors, bands, extensions, and more for optimal visibility on your trading charts.
Tips and Tricks for Anchored VWAP Trading Strategies:
- • Anchoring from Notable Levels: Set anchor points from key swing highs/lows, breakouts, high volume nodes, etc. for increased significance.
- • Adjusting Settings for Clarity: Experiment with transparency, line weights, and band widths for easy interpretation.
- • Combining with Other Indicators: Use anchored VWAP in conjunction with support/resistance lines, moving averages, etc. for added confluence.
- • Managing Multiple Anchors: Assign specific colors to different anchored VWAPs for easy tracking on the same chart.
Examples and Use Cases:
✅ Bullish Anchored VWAP Signal: When price crosses above an anchored VWAP level, it could signal increased buying pressure for a potential long entry, with the anchored level acting as support.
❌ Bearish Anchored VWAP Signal: If price crosses below an anchored VWAP level, it may indicate growing selling pressure, making that level a potential resistance