


Before you leave...
Check our Sierra Chart Suite PRO

Custom Study for Sierra Chart
Identify high-probability reversals using per-bar Volume Profile Point of Control analysis — with structural wick filtering, continuous POC cluster detection, and confluence labeling.
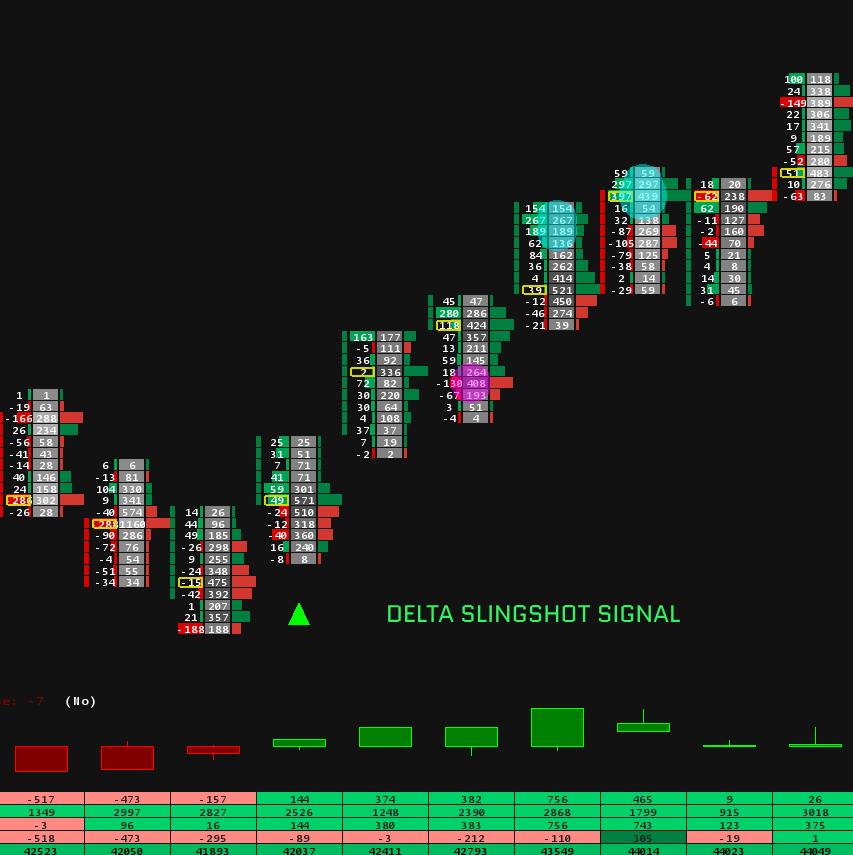
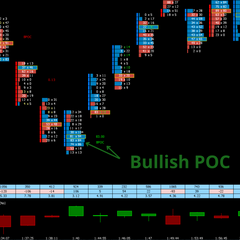
The Bullish/Bearish POC Indicator identifies the Point of Control — the price level with the highest traded volume inside each bar — and flags when that POC appears at a structural extreme. A POC rejected at the top or bottom of a bar signals aggressive buying or aggressive selling stepping in at a key level.
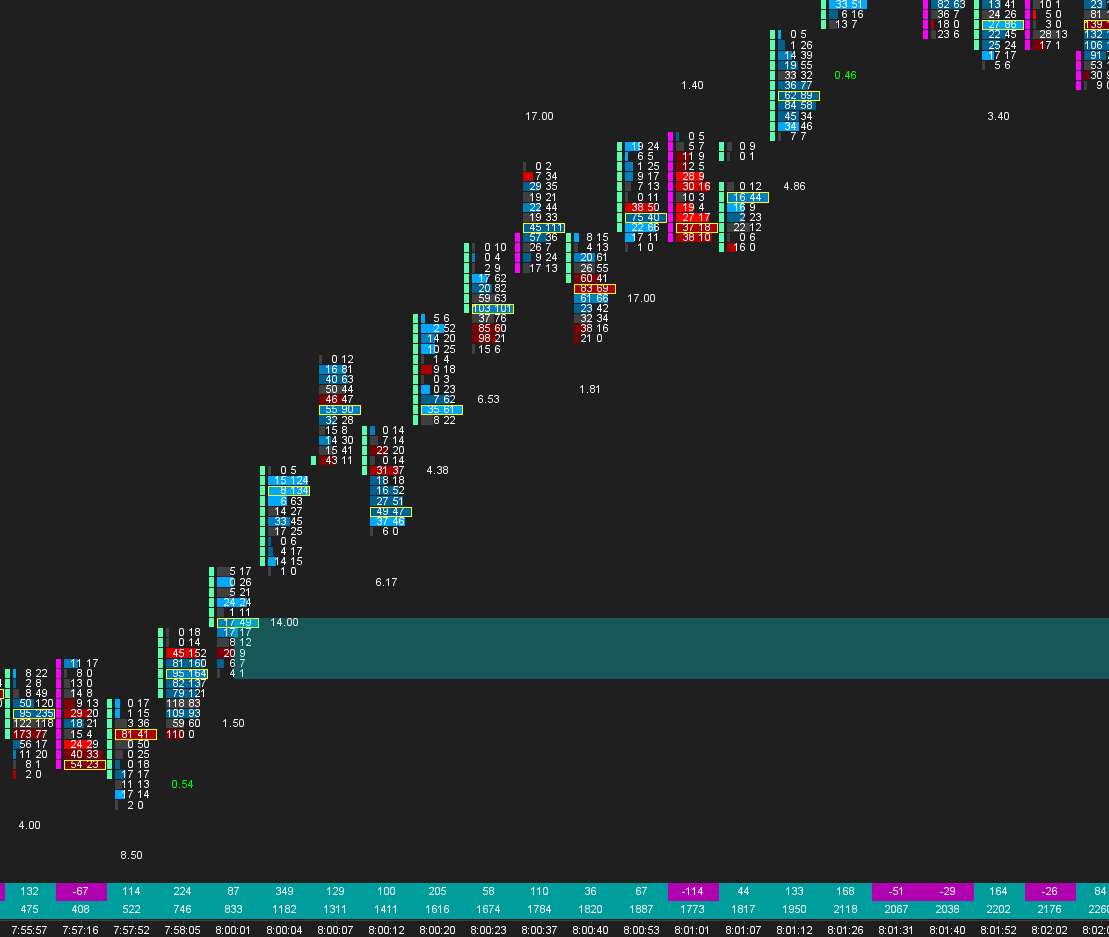
Version 2.0 introduces a wick structural filter that tightens signal quality, Continuous POC cluster detection that identifies price levels the market keeps returning to, and a CT confluence label that merges both signals when they align on the same bar.
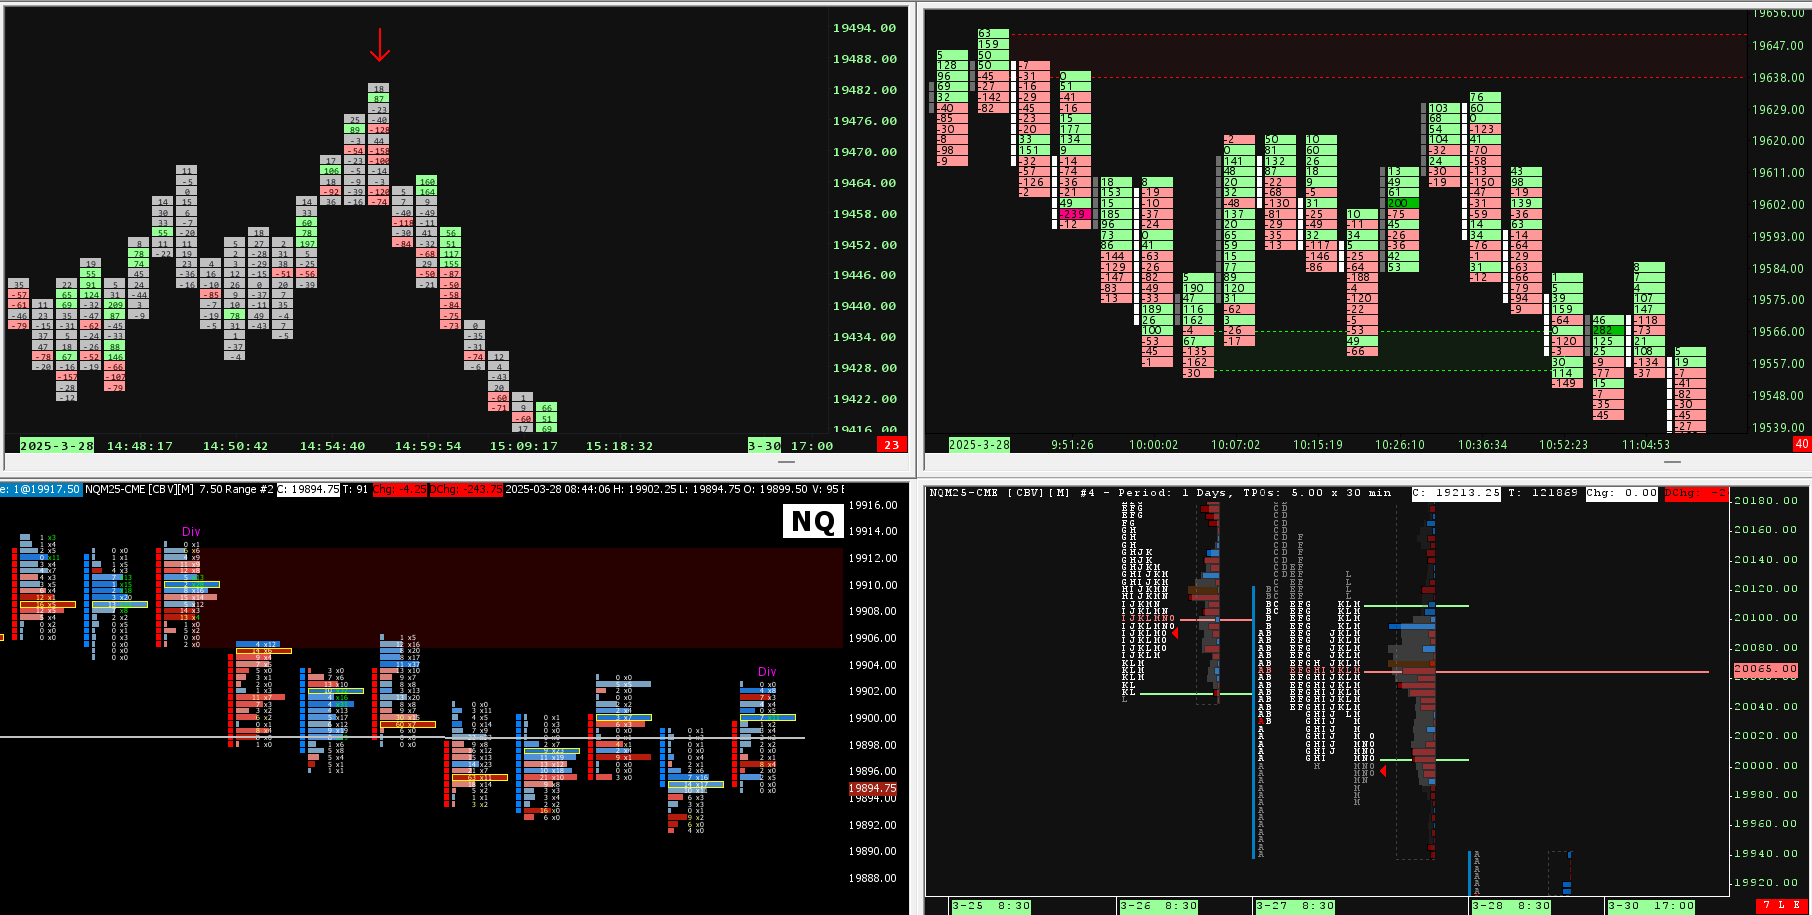
Bullish bar with POC at the low extreme. Volume accumulated at the bottom signals buyers defending the level aggressively.
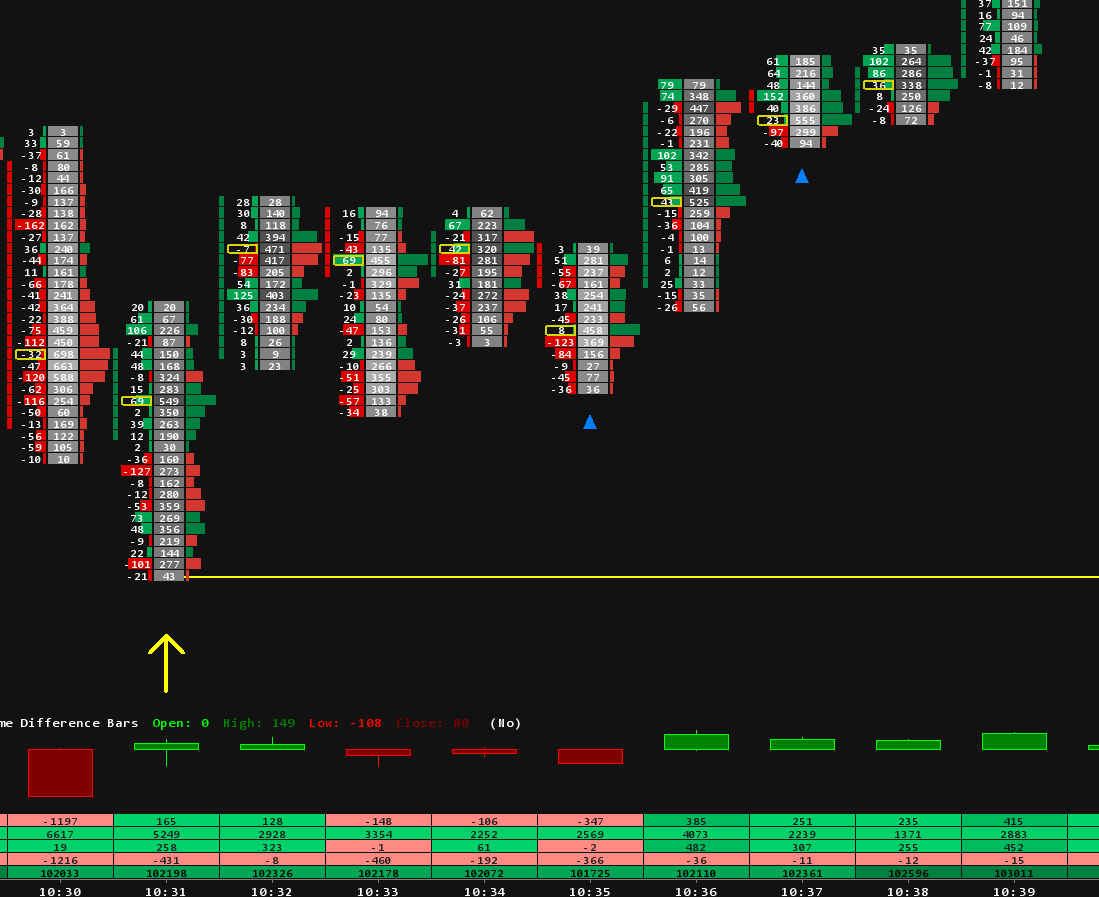
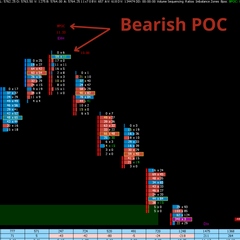
Bearish bar with POC at the high extreme. Volume accumulated at the top signals sellers defending the level aggressively.
Two or more consecutive bars sharing the same POC level — a sticky price zone the market keeps returning to and accepting.
Require the POC to sit strictly in the rejected wick — not touching the body. Toggle on/off. Significantly reduces false signals on inside-body POC bars.
Scans the full lookback for consecutive bars sharing a POC level. Marks each bar in the run with a price-row dash at the exact POC price.
When BP or SP fires on a Continuous POC bar, a single merged label replaces separate drawings. CT / BP and CT / SP are your highest-conviction setups.
Full control over lookback, threshold %, font size, tick offset, colors, and all feature toggles. Tune to any instrument or trading style.
Important: Make sure you have updated to the latest version of Sierra Chart
After purchasing one of our indicators, please contact us and provide your Sierra Chart username so we can activate the indicator. Once it has been activated, restart your Sierra Chart platform.
Next, open Sierra Chart and the chart where you want to add the indicator:
1. Go to Analysis in the top menu bar.
2. Click on Studies.
3. In the "Studies" window, click Add Custom Study....
4. Find your new indicator in the list , select it, and click Add.
Template included with the indicators:
Copy the template file received by email template.cht into your C:\SierraChart\Data\ folder. Restart your Sierra Chart platform, open the Chartbook
To get the most out of our Sierra Chart templates, you need at least the following subscription:
“Integrated Sierra Chart with Advanced Features (Service Package 5) at 36 USD”.
We also recommend purchasing the “Denali Exchange Data Feed” data source, for access to accurate, professional market data.
(Denali : 11usd with a Stage5 broker account)
Our templates are available as one-time purchases, meaning you pay once and own the template indefinitely. There are no monthly subscription fees associated with our products, allowing you to use them without ongoing costs.
- Be sure to update to the latest version of sierrachart.
- Copy the template file received by Email, template.cht into your \SierraChart\Data\ folder.
- Restart your Sierra Chart platform and open the corresponding Chartbook.
Unfortunately, we do not offer trial versions of our Templates / Chartbooks. However, we provide detailed descriptions and support to help you understand how our templates work and how they can enhance your trading experience.
Yes, we offer 7 days Trial for our indicators, please email us your sierra chart username for activation.
We are committed to providing high-quality templates. Refunds are only issued for verified technical issues with our products. Technical support is available to assist you in resolving any problems you may encounter.
Our team of traders and Sierra Chart experts also offers personalized coaching to help you get started with the Sierra Chart platform.
Our templates are optimized and configured to work on a specific market (NQ, ES, ZN, Gold...). However, if you have advanced knowledge of your market and SierraChart, it is possible to modify the settings to match the characteristics, schedules, etc. of another market.
Thanks for subscribing!
This email has been registered!
| Product | SKU | Description | Collection | Availability | Product Type | Other Details |
|---|