




Before you leave...
Check our Sierra Chart Suite PRO
Custom Study for Sierra Chart


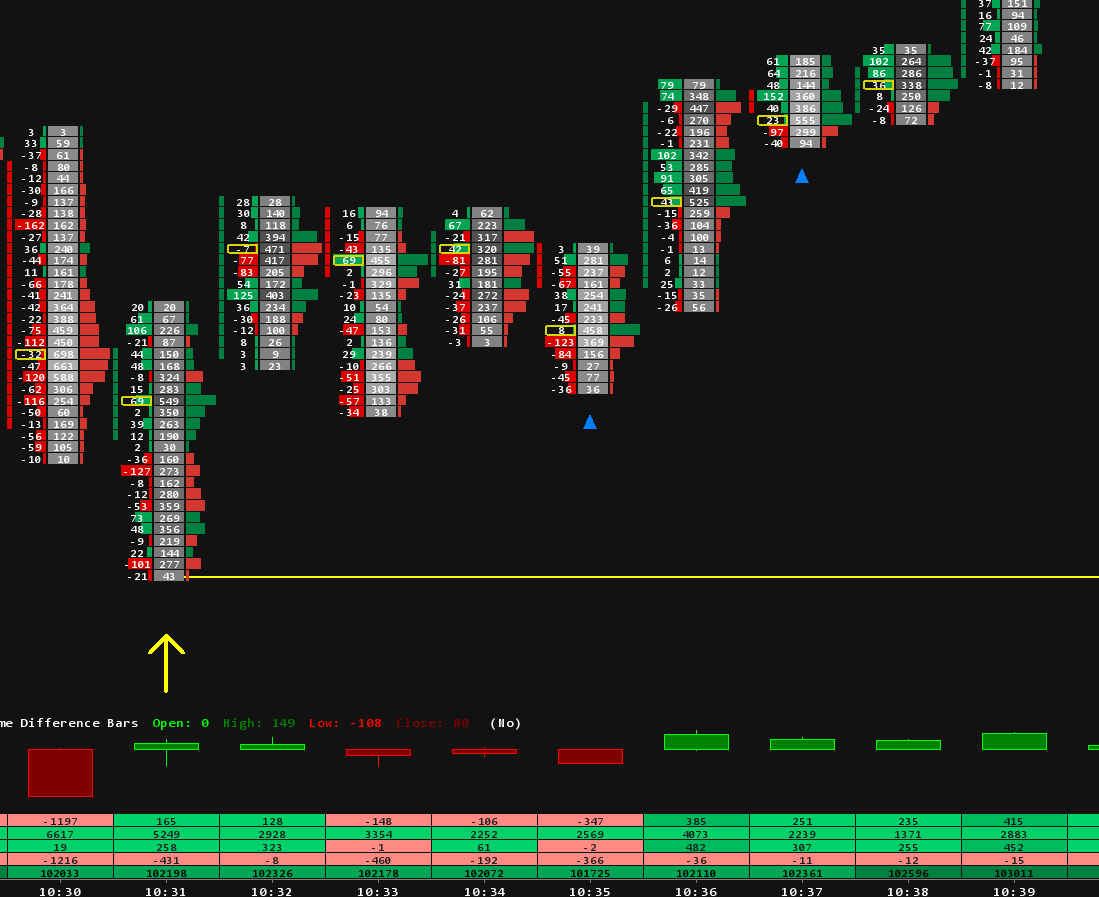
Delta Surge Reversals reads the delta of every bar and marks the moment it swings hard against the bar before it, at a swing high or low. A triangle prints on that bar, below it for a bullish surge and above it for a bearish one.
When a bar's delta swings hard against the bar before it, at a swing point, a triangle prints under the low for a bullish surge and over the high for a bearish one. No lines to draw, no panel to watch.
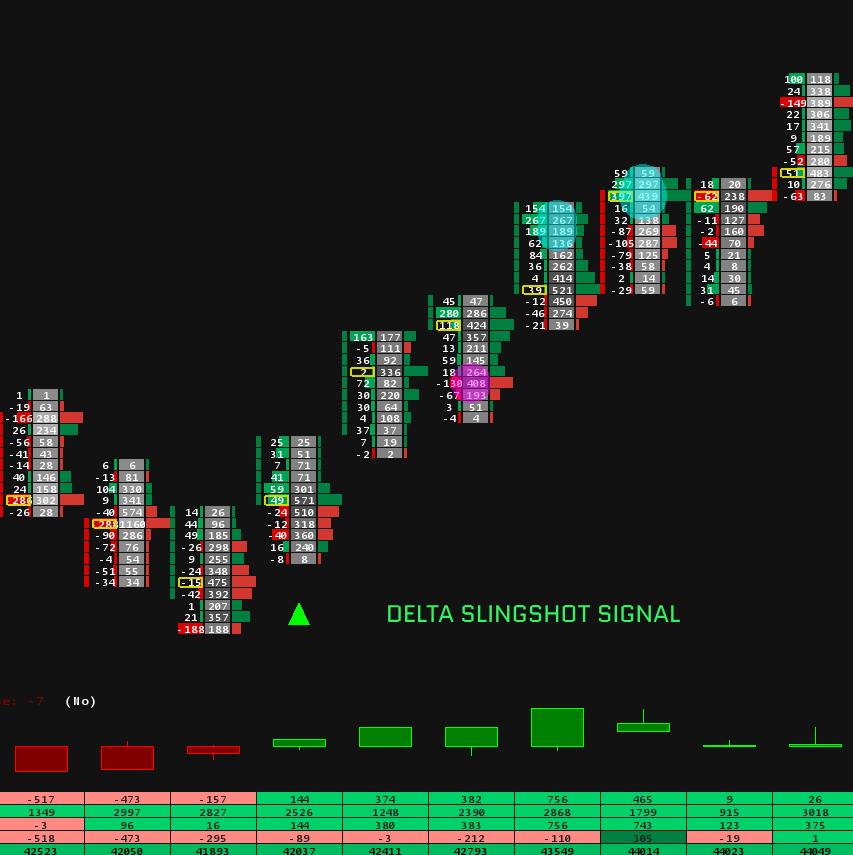
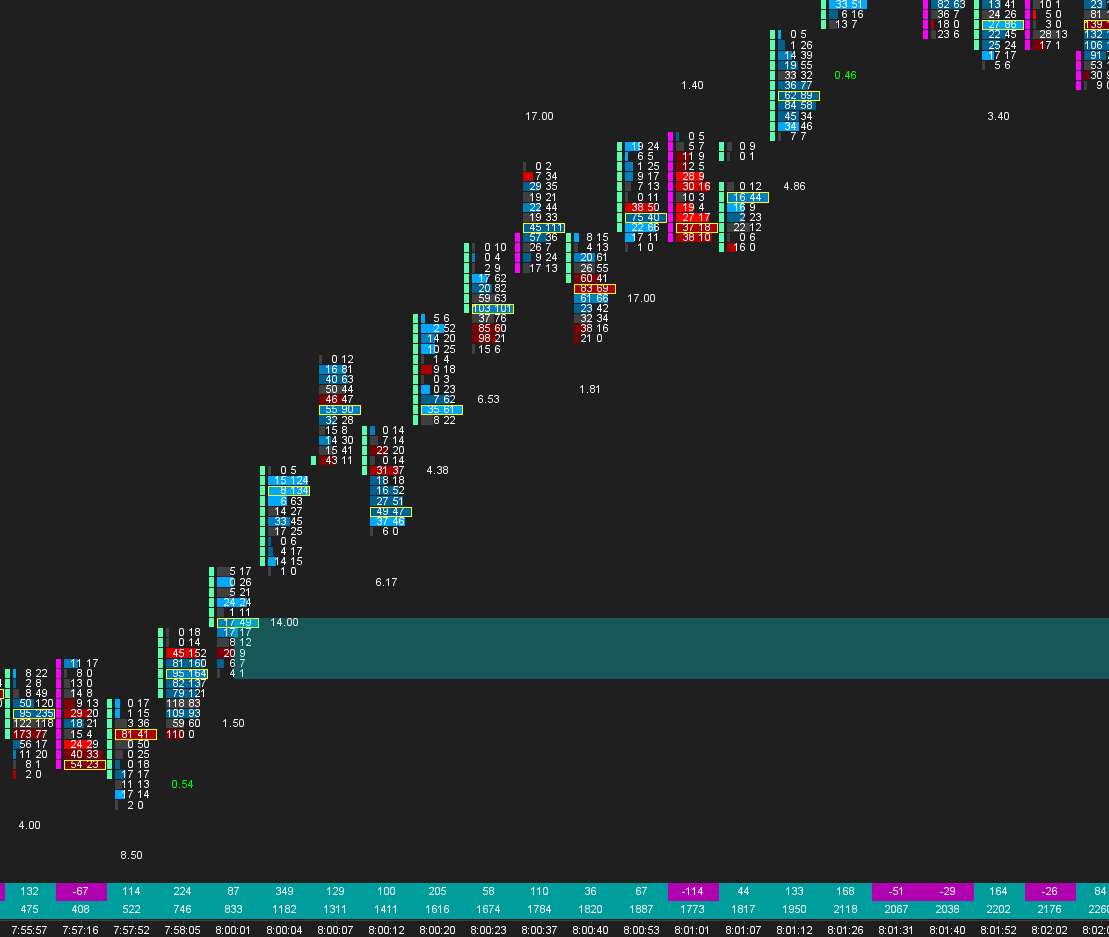
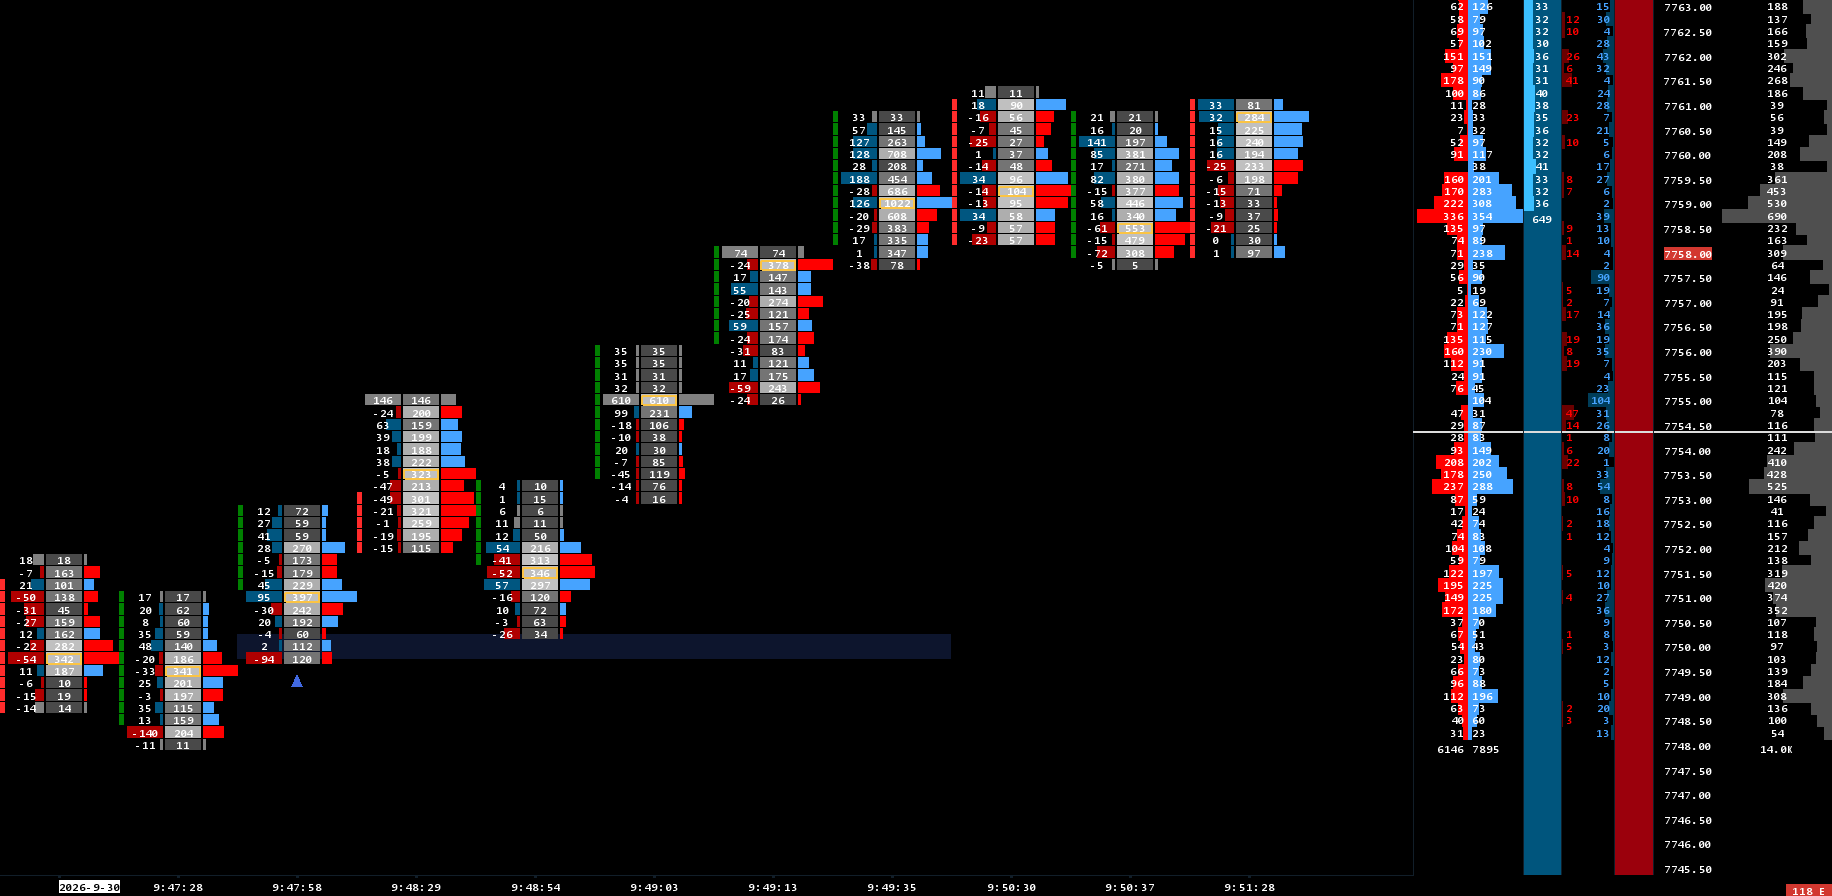
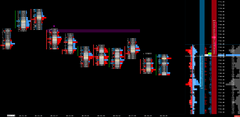
Bullish surge on a footprint. The blue triangle sits under the low of the signal bar. The box shades the bottom of that bar and runs to the right.
Bearish surge on a footprint. The magenta triangle sits above the high of the signal bar. The box shades the top of that bar and runs to the right.
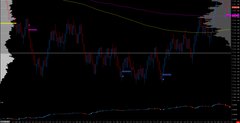
The same markers on 1 minute candles. A triangle marks each bar where delta swung hard against the bar before it, at a swing point.
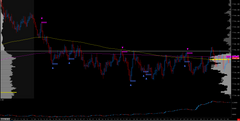
The same markers on a range bar chart. Same rule, different bars: each triangle is a surge at a swing point.
An optional translucent box shades the signal bar's extreme and runs to the right, so you can still see where the surge happened after price has moved on.
Price shows the turn. The order flow underneath is what explains it.
Swing highs and lows show where price turned. They cannot show whether order flow changed hands at that point.
One bar's delta means little alone. The change from the bar before is what matters, and nobody tracks that by eye.
By the time you have compared two deltas and checked for a swing, the turn is already behind you.
A bar's delta, ask volume minus bid volume, turns hard against the delta of the bar before it. You decide how hard, in percent, and the smallest delta that counts.
The bar has to close in the direction of the surge: up for a bullish signal, down for a bearish one.
The surge must come at a fresh swing low or high, so the marker points at a possible turn, not just movement. You can switch that requirement off.
This is an order flow study, so it needs order flow data. Check these three things and it will work.
The study runs on intraday charts.
Your Sierra Chart account needs Package 5 or higher.
Your data service must supply bid and ask volume. Without it every delta is zero and nothing is marked.
Each control moves the signal count one way. Change one at a time and watch your own instrument.
| Control | More signals | Fewer signals |
|---|---|---|
| Bullish and Bearish Surge (%) | Lower it | Raise it |
| Minimum Signal Bar Delta | Lower it, or 0 for off | Raise it |
| Swing filter | Off, or a shorter lookback | On, with a longer lookback |
| Swing Within | Allow more bars before the signal | The signal bar only |
Marker distance, box size and colours are cosmetic. They never change what is marked.
Signals appear across all your loaded history. Scroll back through weeks of data and they are already there, not just the ones since you attached the study.
Ignore surges that are big in percent but small in contracts. Set a minimum delta for the signal bar, in contracts, and surges that fall short of it are not marked. It is off until you set it.
Reload the chart and the study draws the same markers from the same data. Each bar's result depends only on the chart data and your settings, never on what the study saw earlier.
See where the surge happened after the bar has gone. A translucent box shades the signal bar's low or high and runs to the right for as many bars as you choose.
Get told when a bar shows a surge. One alert per signal bar, with bullish or bearish in the message, even when several bars close at once in a fast market. Nothing sounds when a chart reloads.
Compiled code, no scripting layer. It runs inside Sierra Chart's own study loop, like a built-in study.
Watch delta swing against the bar before it and the marker print at the swing.
This is all of it. Pick how strong a surge has to be on each side, the smallest delta that counts, and how strict the swing filter is, and you are done. The rest is housekeeping.
Marker and box colours live where they belong, in Sierra Chart's own subgraph settings, so they behave exactly like every other study on your chart.
A footprint template that splits every price into three columns: the delta between ask and bid volume, the volume traded, and a profile of which side dominated. The session volume profile and its delta sit beside the bars. Drops straight into Sierra Chart, already configured.
Ask volume minus bid volume at every price.
The volume traded at each price level.
A profile of which side, ask or bid, dominated each price, as a percentage.
The session volume profile and the session volume profile delta, beside the bars.
One-time payment. Instant download. Lifetime updates. No subscriptions, no recurring fees.
Get The Study Now Ask for your free 7-day trialDelta Surge Reversals is a chart analysis study. It identifies a specific order flow pattern on a bar. It does not predict price, and it is not a trading system, financial advice, or a solicitation to trade. Futures trading carries substantial risk of loss and is not suitable for every investor. Past chart behaviour does not indicate future results. Requires Sierra Chart Package 5 or higher and an intraday chart with bid and ask volume, stored at 1 Tick.
Important: Make sure you have updated to the latest version of Sierra Chart
After purchasing one of our indicators, please contact us and provide your Sierra Chart username so we can activate the indicator. Once it has been activated, restart your Sierra Chart platform.
Next, open Sierra Chart and the chart where you want to add the indicator:
1. Go to Analysis in the top menu bar.
2. Click on Studies.
3. In the "Studies" window, click Add Custom Study....
4. Find your new indicator in the list , select it, and click Add.
Template included with the indicators:
Copy the template file received by email template.cht into your C:\SierraChart\Data\ folder. Restart your Sierra Chart platform, open the Chartbook
To get the most out of our Sierra Chart templates, you need at least the following subscription:
“Integrated Sierra Chart with Advanced Features (Service Package 5) at 36 USD”.
We also recommend purchasing the “Denali Exchange Data Feed” data source, for access to accurate, professional market data.
(Denali : 11usd with a Stage5 broker account)
Our templates are available as one-time purchases, meaning you pay once and own the template indefinitely. There are no monthly subscription fees associated with our products, allowing you to use them without ongoing costs.
- Be sure to update to the latest version of sierrachart.
- Copy the template file received by Email, template.cht into your \SierraChart\Data\ folder.
- Restart your Sierra Chart platform and open the corresponding Chartbook.
Unfortunately, we do not offer trial versions of our Templates / Chartbooks. However, we provide detailed descriptions and support to help you understand how our templates work and how they can enhance your trading experience.
Yes, we offer 7 days Trial for our indicators, please email us your sierra chart username for activation.
We are committed to providing high-quality templates. Refunds are only issued for verified technical issues with our products. Technical support is available to assist you in resolving any problems you may encounter.
Our team of traders and Sierra Chart experts also offers personalized coaching to help you get started with the Sierra Chart platform.
Our templates are optimized and configured to work on a specific market (NQ, ES, ZN, Gold...). However, if you have advanced knowledge of your market and SierraChart, it is possible to modify the settings to match the characteristics, schedules, etc. of another market.
Thanks for subscribing!
This email has been registered!
| Product | SKU | Description | Collection | Availability | Product Type | Other Details |
|---|