




Before you leave...
Check our Sierra Chart Suite PRO
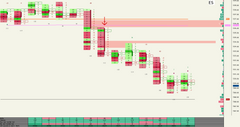
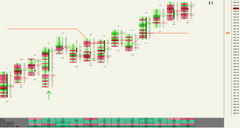
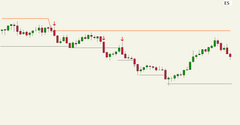

Custom Study for Sierra Chart


Aggressor Reversal Bar reads the aggression inside a single bar and marks the moment one side loses control of it. Confirmed on the close. It never repaints. And there is nothing to calibrate, on any market or any bar period.
Almost none of them look at the order flow underneath the bar.
Pin bars, engulfing candles, long wicks. Reversal detection usually reads the shape of a bar and nothing else.
The shape never tells you who was actually aggressive, at what price, or whether it worked for them.
A threshold that fits ES is noise on NQ and unreachable on a thin contract. New market, new guesswork.
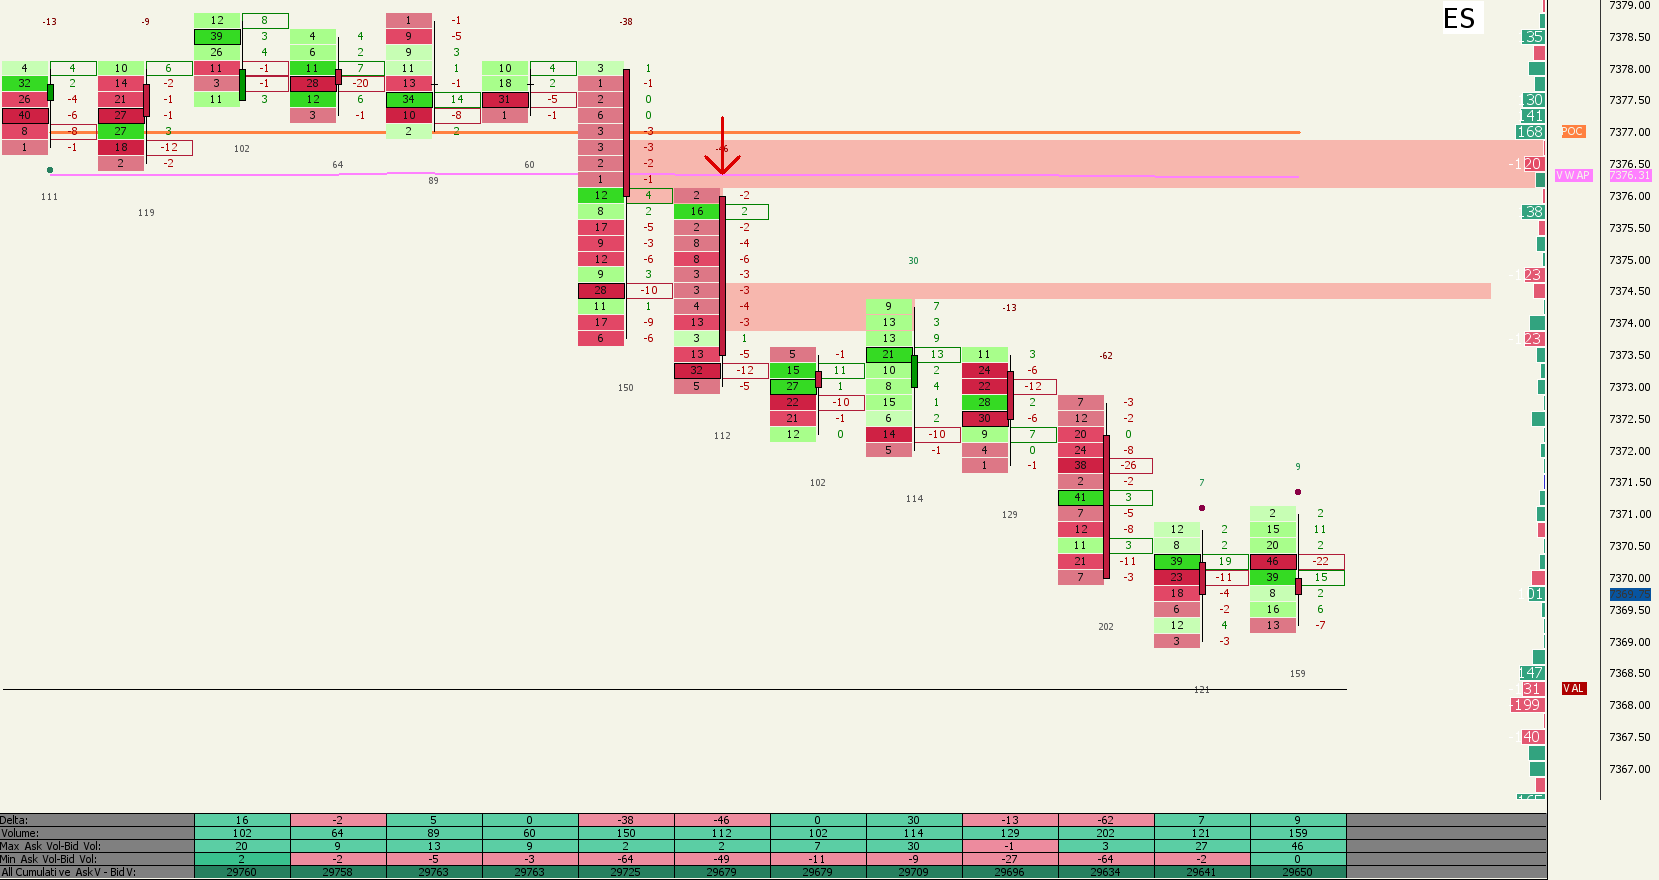
No zones to interpret, no clouds to argue with. When a bar shows genuine two-sided aggression with a failed side, an arrow prints above or below it. Once, on the close, and it never moves again.
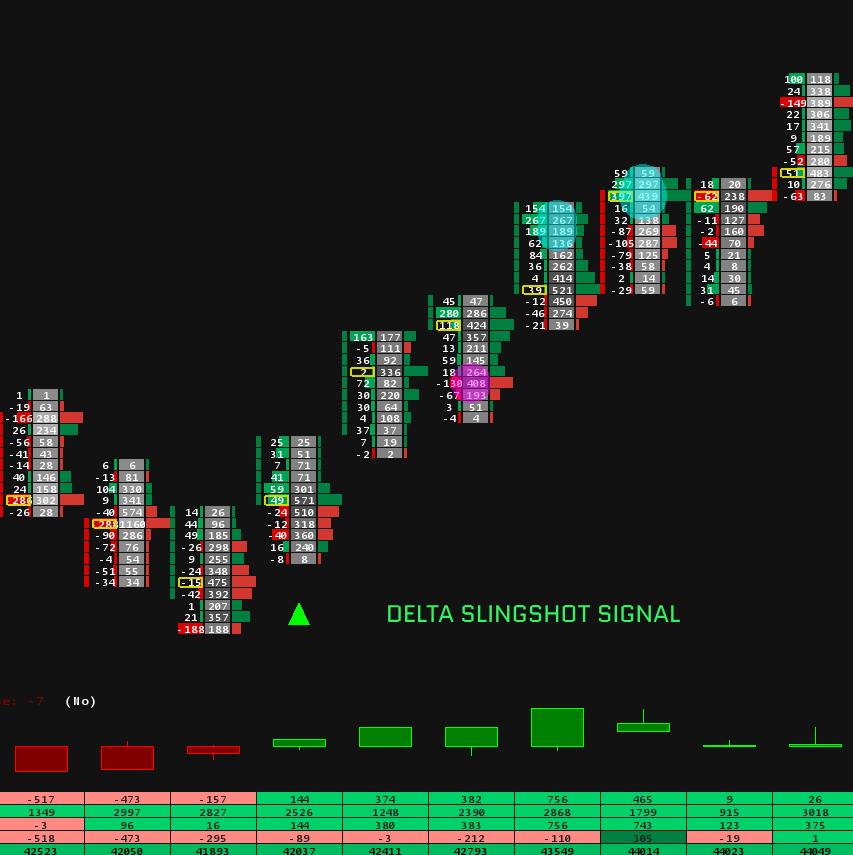
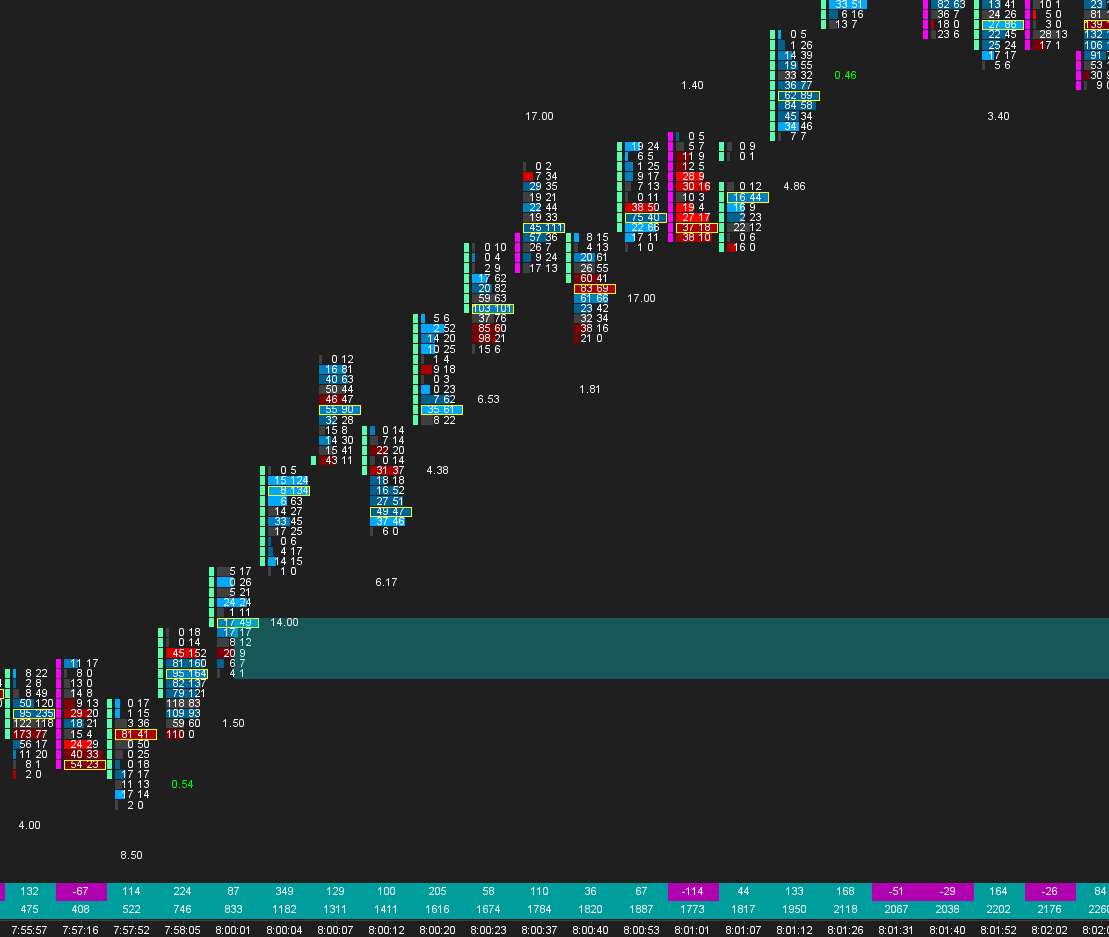
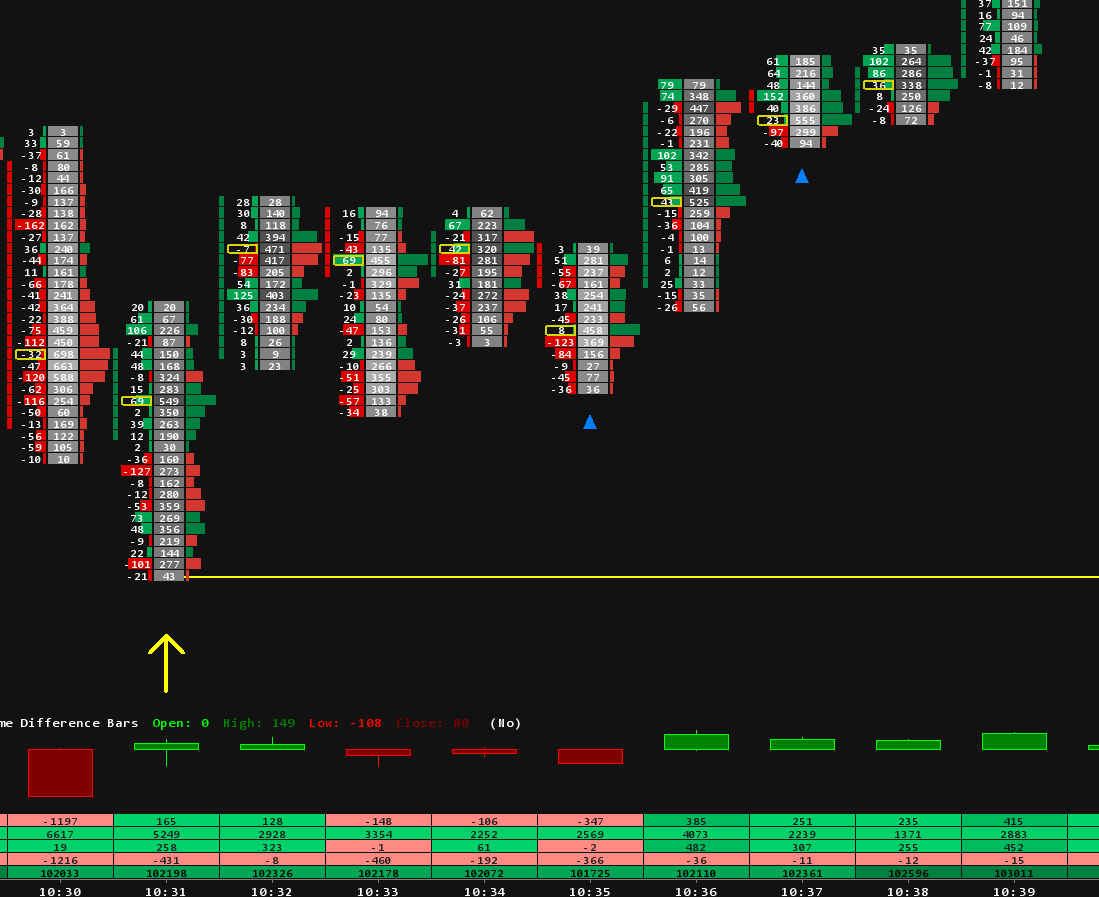
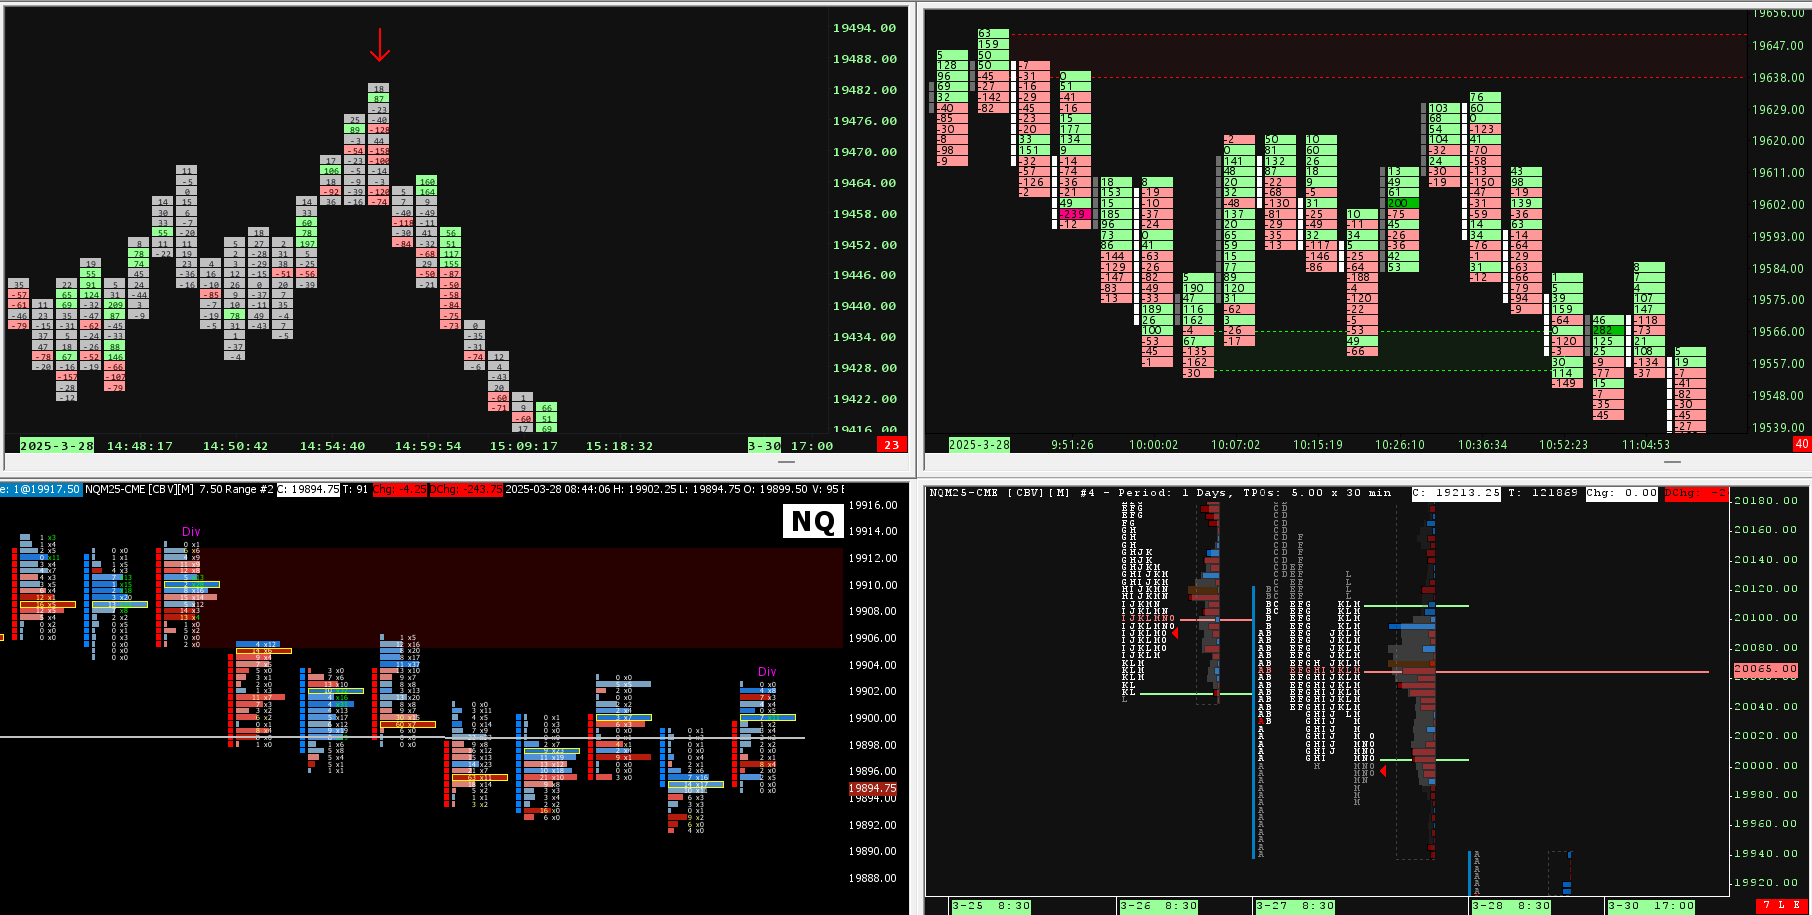
The same signal on the footprint you already trade, on plain candles, or on Renko. Tap any image to enlarge it.
The arrow stand-off scales with the instrument automatically, so it sits correctly on a four-tick range bar and on a wide NQ candle without you touching a thing.
Real aggression from buyers and from sellers, inside the same bar. Only one of them can be right.
The study works out which one lost control of the bar. When it cannot tell, the bar is discarded.
Several independent checks have to agree before an arrow prints. You decide how many.
Every order flow tool asks you for the same things. A minimum volume. An imbalance ratio. A delta threshold. Each one is correct for exactly one instrument on exactly one bar period, and wrong the moment you change either.
Aggressor Reversal Bar does not ask. It works out what "heavy" means from the bar in front of it, and what "big" means from the bars behind it.
Move it from ES to NQ. From 1-minute to 2000-tick. From the cash open to a quiet afternoon. The settings stay exactly where you left them.
Pick how selective you want to be. Everything else adjusts behind it, and every level still produces signals. Tightening the dial makes them rarer, never impossible.
| Sensitivity | Loose | Normal | Strict |
|---|---|---|---|
| Signal frequency | Highest | Balanced | Lowest |
| Evidence required | Pattern only | Confirmed | Strongly confirmed |
| Best suited to | Scanning for context | Everyday trading | Waiting for the best only |
A fourth option, Custom, opens the underlying values for traders who want to set them by hand.
Move it to a new instrument and it just works. No contract counts, no tick counts, nothing that breaks when liquidity changes.
What you see in replay is what you would have seen live. Signals are evaluated on closed bars only, and never revised afterwards.
Time, tick, volume, range, Renko. Grouped footprint levels are handled correctly, and narrow bars are not silently skipped.
Trade only the side you want. One setting hides the other direction completely, so a long-only chart stays clean.
Get told the moment a bar closes into a signal. One alert per bar, with the symbol and the direction in the message. No duplicates on history reloads.
Not just an arrow. The imbalance counts, zone size and confirmation score sit in Sierra Chart's Values Window, and can be read by spreadsheet studies and alert formulas.
Watch a trapped push resolve, from the imbalance stack to the arrow.
This is all of it. Pick a sensitivity, pick whether you want longs, shorts or both, and you are done. The rest is housekeeping.
Arrow colours live where they belong, in Sierra Chart's own subgraph settings, so they behave exactly like every other study on your chart.
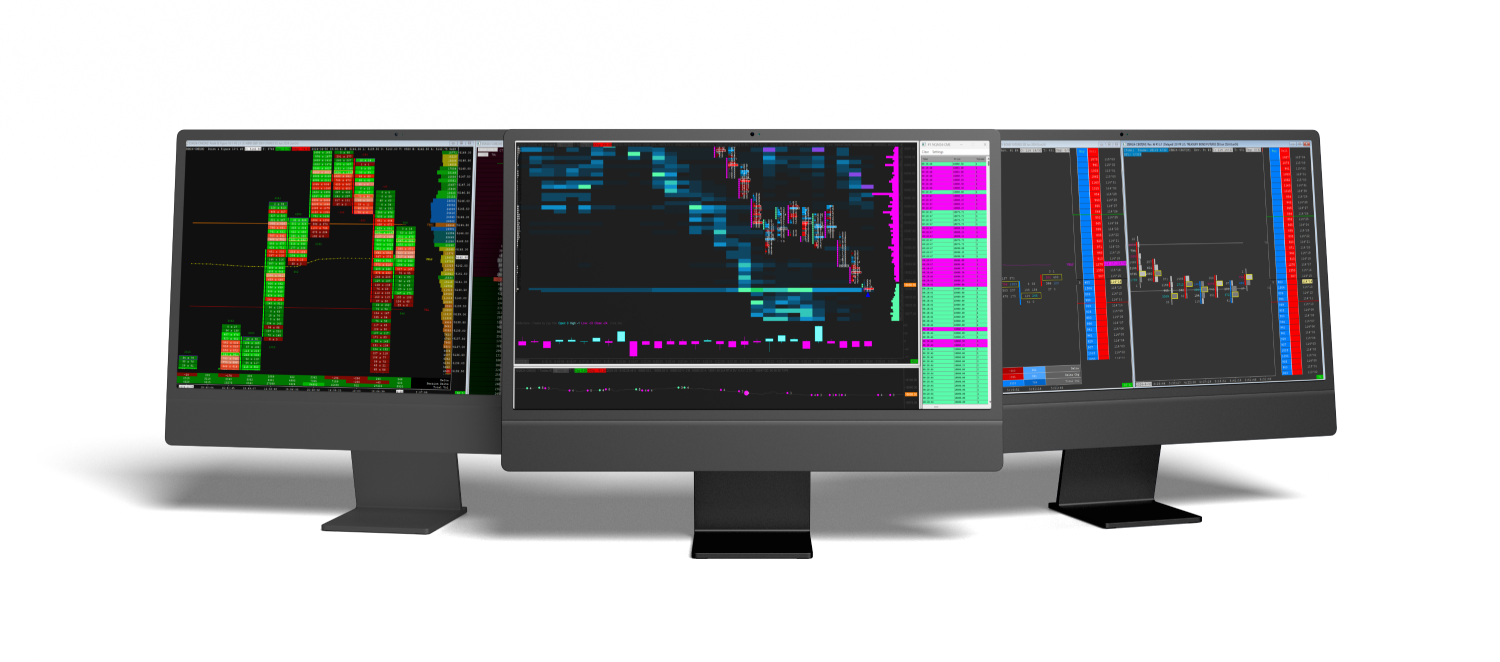
A premium intraday template combining range bar charts with full volume and delta footprint analysis. Overlay candlesticks, an integrated DOM and volume profile delta, for complete market insight. Drops straight into Sierra Chart, already configured.
With volume & delta footprint visualization
For enhanced price action clarity
Seamless Depth of Market display
With VAH, VAL & POC levels
Track institutional activity
Anchored reference points
Advanced analysis tools
Real-time order flow data
One-time payment. Instant download. Lifetime updates. No subscriptions, no recurring fees.
Get The Study Now Ask for your free 7-day trialAggressor Reversal Bar is a chart analysis study. It identifies a specific order flow pattern on closed bars. It does not predict price, and it is not a trading system, financial advice, or a solicitation to trade. Futures trading carries substantial risk of loss and is not suitable for every investor. Past chart behaviour does not indicate future results. Requires an intraday chart with bid and ask volume at price data.
Important: Make sure you have updated to the latest version of Sierra Chart
After purchasing one of our indicators, please contact us and provide your Sierra Chart username so we can activate the indicator. Once it has been activated, restart your Sierra Chart platform.
Next, open Sierra Chart and the chart where you want to add the indicator:
1. Go to Analysis in the top menu bar.
2. Click on Studies.
3. In the "Studies" window, click Add Custom Study....
4. Find your new indicator in the list , select it, and click Add.
Template included with the indicators:
Copy the template file received by email template.cht into your C:\SierraChart\Data\ folder. Restart your Sierra Chart platform, open the Chartbook
To get the most out of our Sierra Chart templates, you need at least the following subscription:
“Integrated Sierra Chart with Advanced Features (Service Package 5) at 36 USD”.
We also recommend purchasing the “Denali Exchange Data Feed” data source, for access to accurate, professional market data.
(Denali : 11usd with a Stage5 broker account)
Our templates are available as one-time purchases, meaning you pay once and own the template indefinitely. There are no monthly subscription fees associated with our products, allowing you to use them without ongoing costs.
- Be sure to update to the latest version of sierrachart.
- Copy the template file received by Email, template.cht into your \SierraChart\Data\ folder.
- Restart your Sierra Chart platform and open the corresponding Chartbook.
Unfortunately, we do not offer trial versions of our Templates / Chartbooks. However, we provide detailed descriptions and support to help you understand how our templates work and how they can enhance your trading experience.
Yes, we offer 7 days Trial for our indicators, please email us your sierra chart username for activation.
We are committed to providing high-quality templates. Refunds are only issued for verified technical issues with our products. Technical support is available to assist you in resolving any problems you may encounter.
Our team of traders and Sierra Chart experts also offers personalized coaching to help you get started with the Sierra Chart platform.
Our templates are optimized and configured to work on a specific market (NQ, ES, ZN, Gold...). However, if you have advanced knowledge of your market and SierraChart, it is possible to modify the settings to match the characteristics, schedules, etc. of another market.
Thanks for subscribing!
This email has been registered!
| Product | SKU | Description | Collection | Availability | Product Type | Other Details |
|---|