


Before you leave...
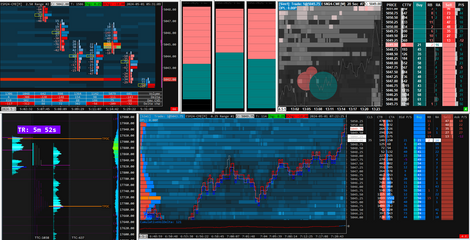
Check our Sierra Chart Suite PRO
Custom Study for Sierra Chart


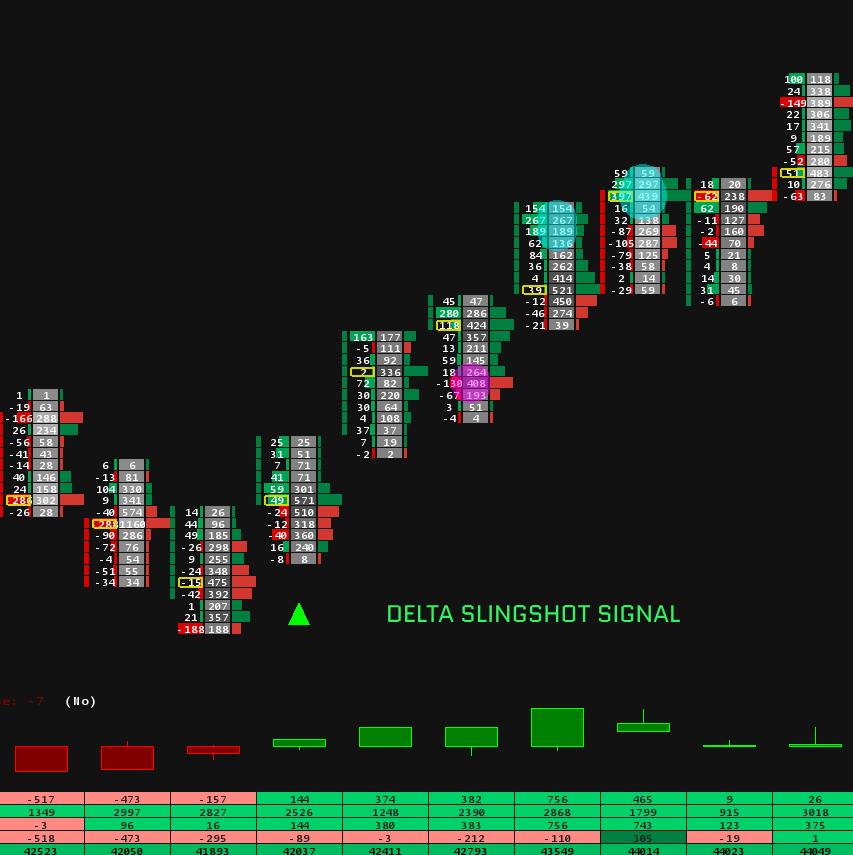
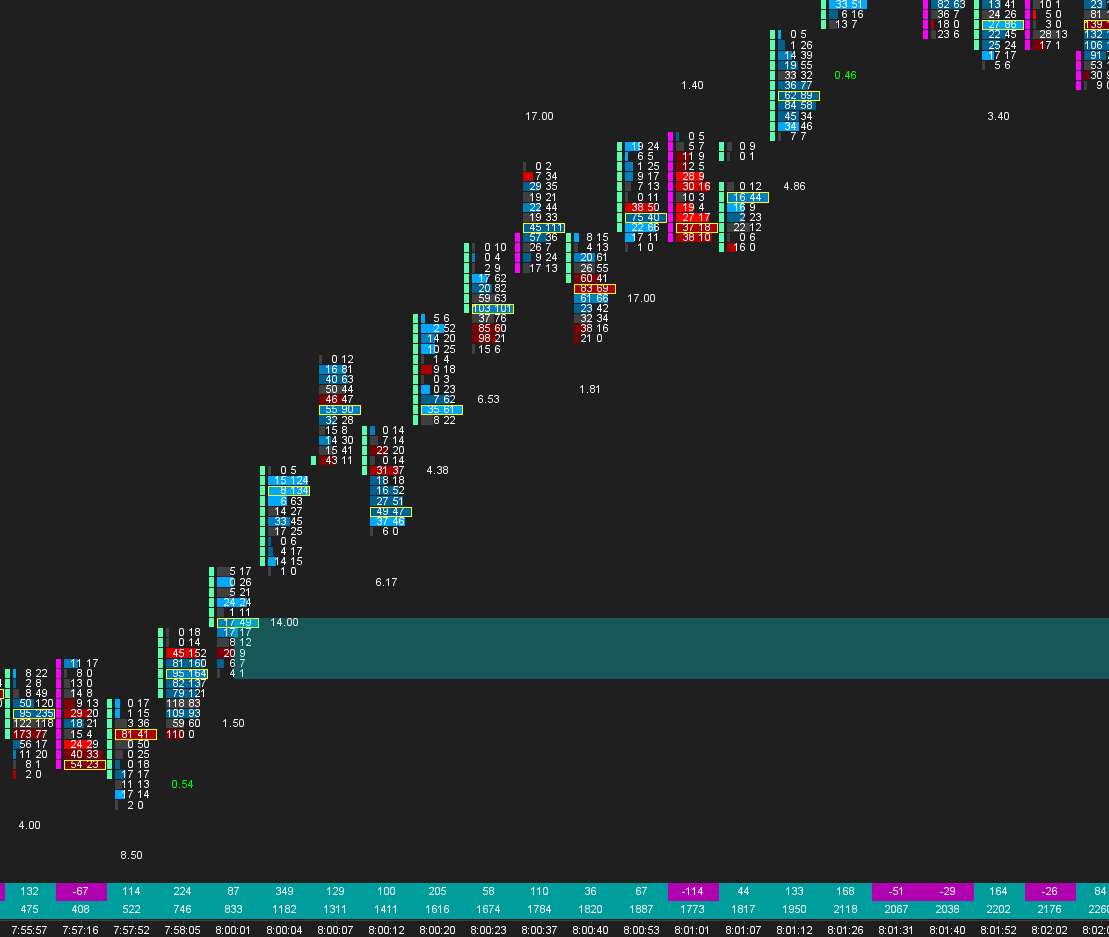
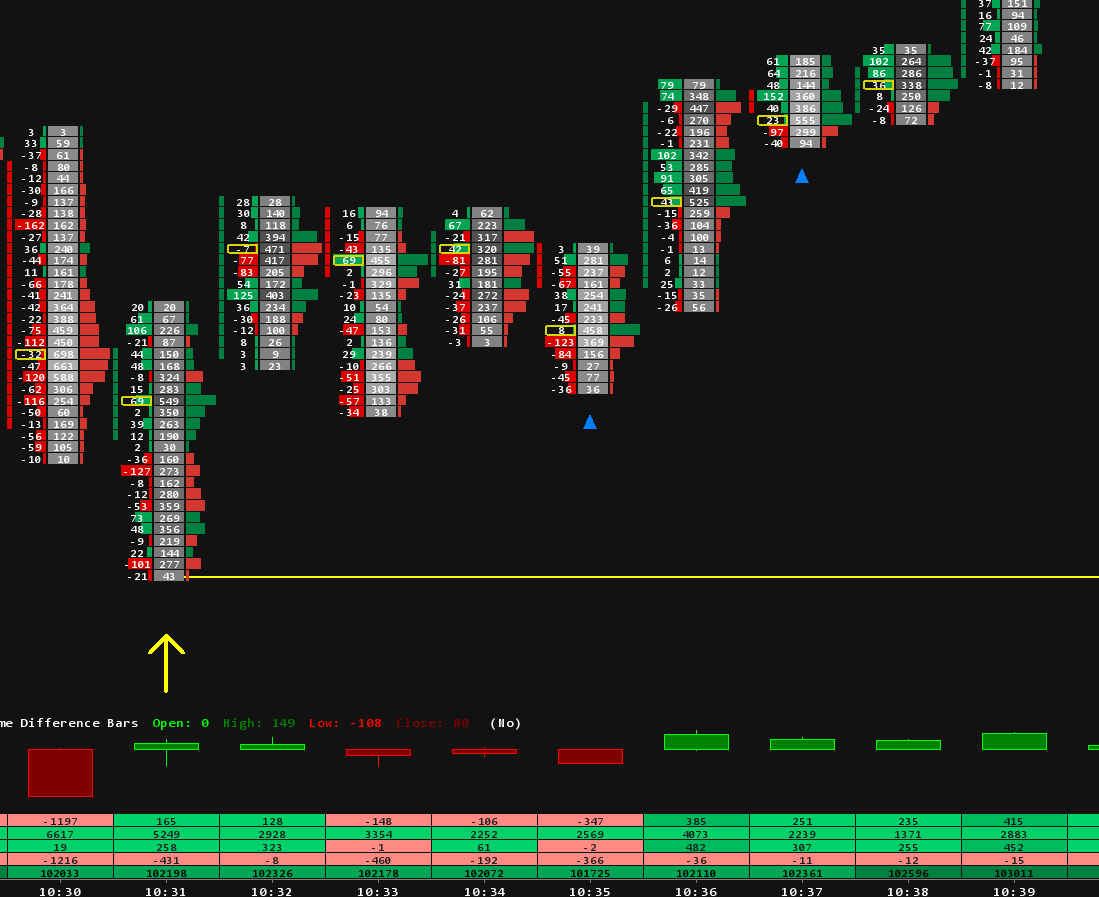
An advanced Sierra Chart indicator that detects diagonal bid/ask imbalances and automatically marks the support & resistance zones the smart money is defending — in real time, on any chart type.
Most traders react to price. By the time the candle prints, the move is already half over. Here's what you're missing.
Without visible absorption, you can't tell a real top from a pause. You short the high, get squeezed, then watch it roll over five minutes after your stop.
Big participants don't move price — they absorb it. If you're only watching candles, you're seeing the consequence, never the cause.
You place stops at "logical" S/R. So does everyone else. The real defended levels are where absorption fires — not where the wick touched.
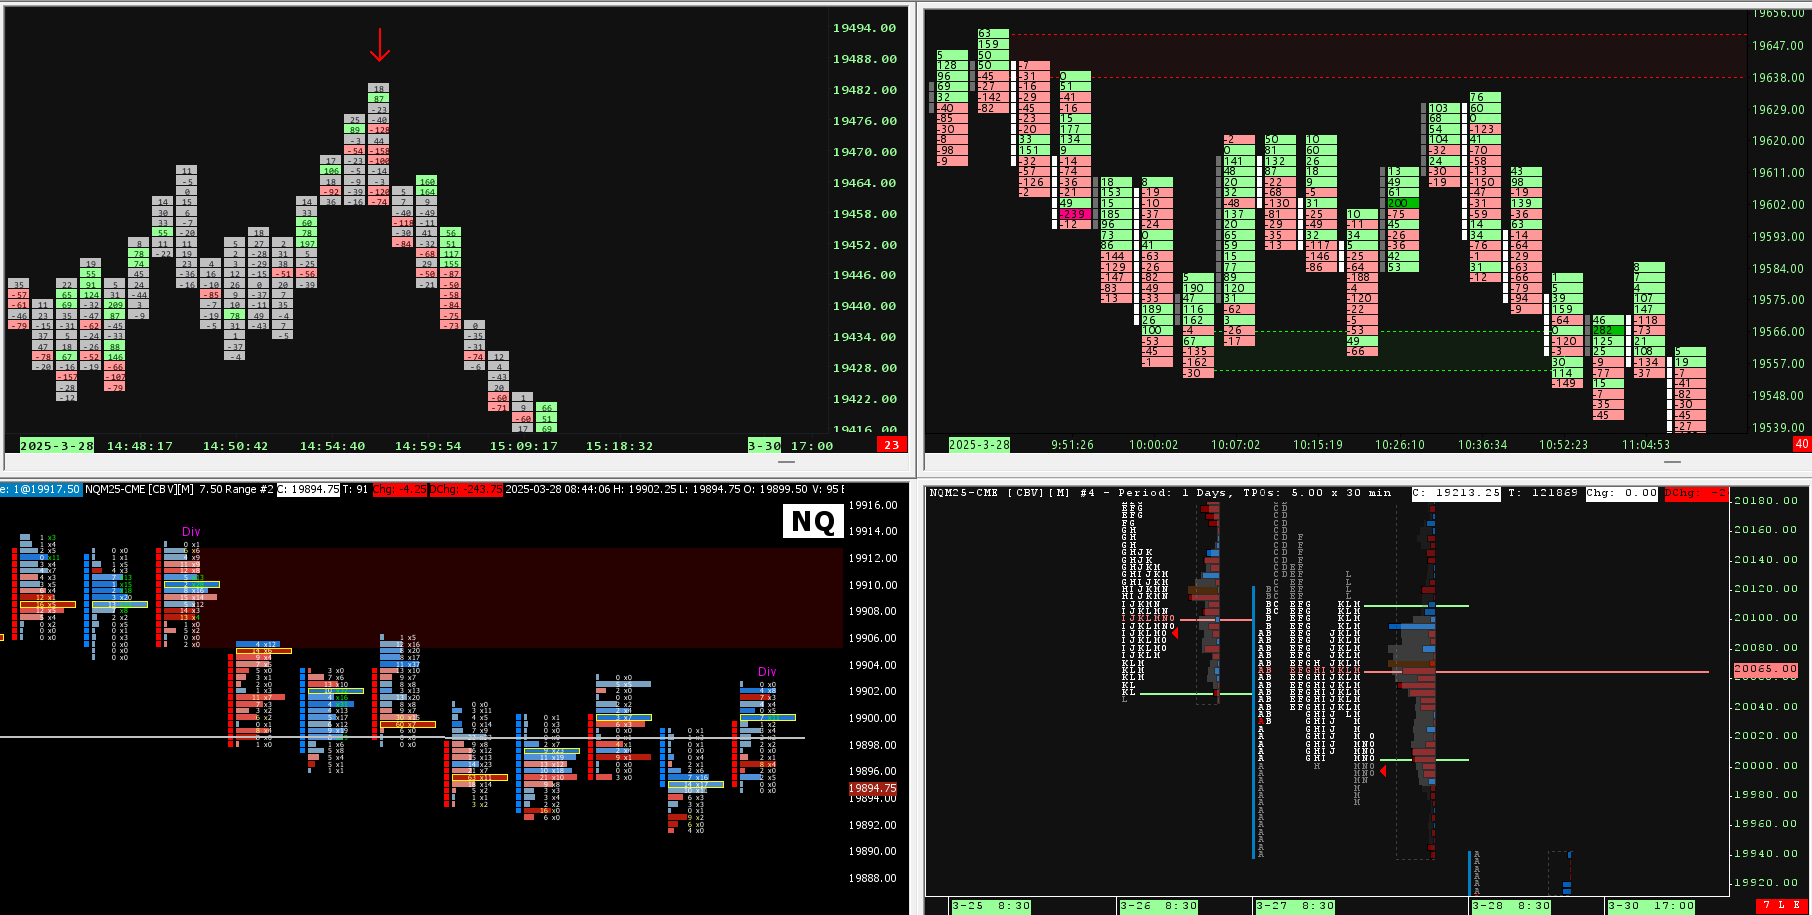
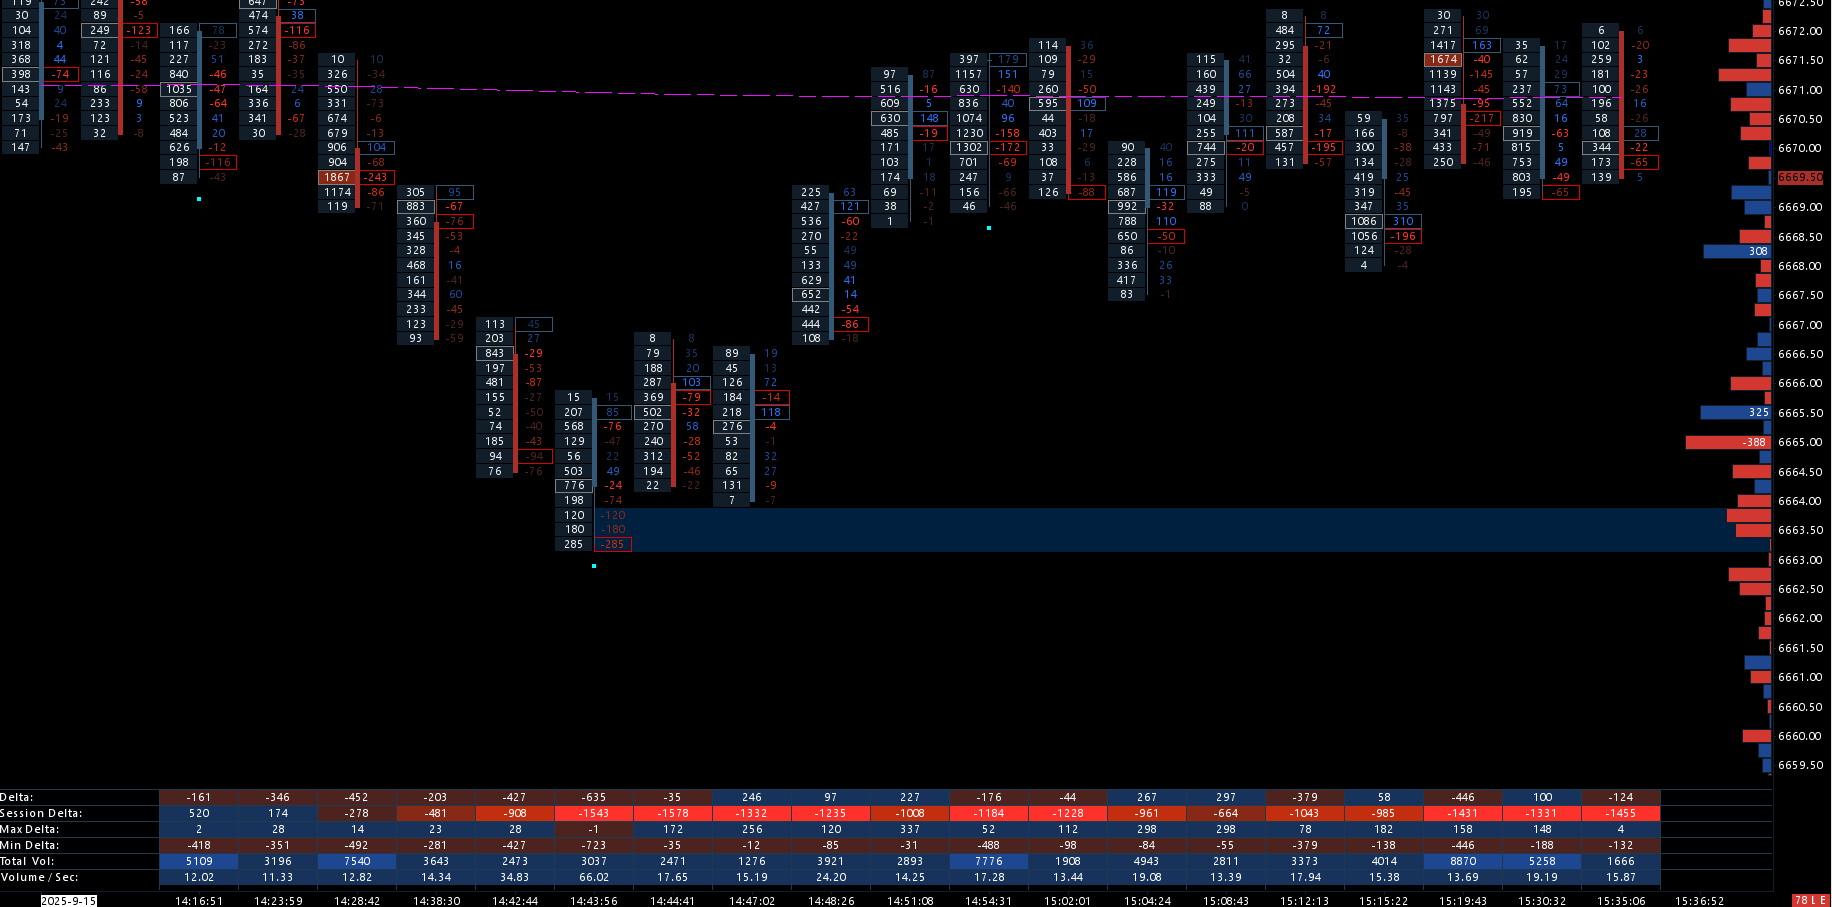
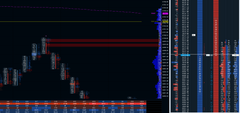
The indicator calculates diagonal bid/ask imbalances bar-by-bar to identify where aggressive orders are being absorbed. Critical zones are flagged visually on both standard candlestick and detailed footprint charts — automatically extended as live support or resistance.
Two independent DLL studies — Bullish and Bearish — load into Sierra Chart in seconds. No external dependencies, no cloud, no monthly fees.
Set your diagonal imbalance threshold, minimum volume, delta filter, and lookback. Calibrate once for your instrument and walk away.
Watch absorption zones print live and extend forward as dynamic support & resistance. Use them for entries, exits, or stop placement.
See absorption before the bar closes — so you're positioned before the reversal candle even prints.
No more manual line drawing. Absorption levels project forward as live S/R until they break.
Bullish and Bearish detection separated — calibrate each side for your asymmetric edge.
Standard candles or full footprint — same signals, same precision. Use the chart you already trade.
Cut noise from real signal with minimum volume thresholds and delta confirmation built in.
ACSIL-compiled performance. No Python bridges, no scripts — runs at Sierra Chart's native speed.
Watch the absorption engine catch a real reversal — start to finish — in under 4 minutes.
The package includes two studies for complete independent configuration of Bullish and Bearish scenarios. Every parameter — imbalance ratio, volume floor, delta filter, lookback, extension behavior — is exposed and editable. Calibrate once, deploy across charts.
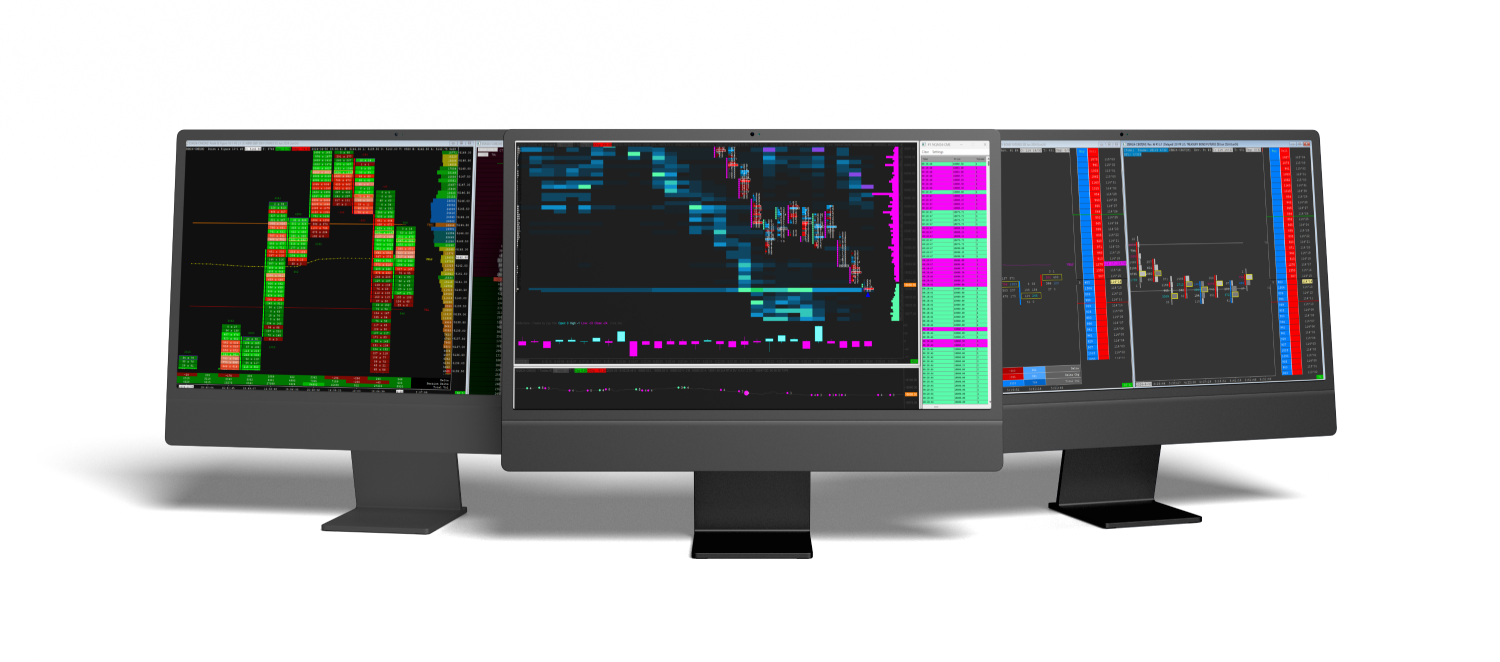
A complete, pre-configured Sierra Chart template (.cht) that drops in instantly. No setup, no fiddling — open it and you're trading on a professional order flow workspace.
One-time payment. Instant download. Lifetime updates. No subscriptions, no recurring fees.
Get The Indicator Now Ask for your free 7-day trialImportant: Make sure you have updated to the latest version of Sierra Chart
After purchasing one of our indicators, please contact us and provide your Sierra Chart username so we can activate the indicator. Once it has been activated, restart your Sierra Chart platform.
Next, open Sierra Chart and the chart where you want to add the indicator:
1. Go to Analysis in the top menu bar.
2. Click on Studies.
3. In the "Studies" window, click Add Custom Study....
4. Find your new indicator in the list , select it, and click Add.
Template included with the indicators:
Copy the template file received by email template.cht into your C:\SierraChart\Data\ folder. Restart your Sierra Chart platform, open the Chartbook
To get the most out of our Sierra Chart templates, you need at least the following subscription:
“Integrated Sierra Chart with Advanced Features (Service Package 5) at 36 USD”.
We also recommend purchasing the “Denali Exchange Data Feed” data source, for access to accurate, professional market data.
(Denali : 11usd with a Stage5 broker account)
Our templates are available as one-time purchases, meaning you pay once and own the template indefinitely. There are no monthly subscription fees associated with our products, allowing you to use them without ongoing costs.
- Be sure to update to the latest version of sierrachart.
- Copy the template file received by Email, template.cht into your \SierraChart\Data\ folder.
- Restart your Sierra Chart platform and open the corresponding Chartbook.
Unfortunately, we do not offer trial versions of our Templates / Chartbooks. However, we provide detailed descriptions and support to help you understand how our templates work and how they can enhance your trading experience.
Yes, we offer 7 days Trial for our indicators, please email us your sierra chart username for activation.
We are committed to providing high-quality templates. Refunds are only issued for verified technical issues with our products. Technical support is available to assist you in resolving any problems you may encounter.
Our team of traders and Sierra Chart experts also offers personalized coaching to help you get started with the Sierra Chart platform.
Our templates are optimized and configured to work on a specific market (NQ, ES, ZN, Gold...). However, if you have advanced knowledge of your market and SierraChart, it is possible to modify the settings to match the characteristics, schedules, etc. of another market.
Thanks for subscribing!
This email has been registered!
| Product | SKU | Description | Collection | Availability | Product Type | Other Details |
|---|